
MV Weekly Market Flash: What...

The bond market has been an active place of late. The Fed’s monetary policy pivot back in January (and an even more dovish position in March), a tempered outlook on global economic growth and related concerns have sparked a broad-based bond rally, with falling yields across most fixed income asset classes. We have been getting a number of questions from our clients about how these dynamics affect the returns they are seeing in the fixed income securities in their portfolios. So here are some key things to keep in mind when you are reviewing the bond portion of your portfolio.
It’s All In the Math
One question that comes up frequently is what drives relative performance between similar securities (e.g., governments or corporates) with different maturities. Consider, for example, the Treasury market. The chart below shows the relative yield trends of the 10-year Treasury note, a key benchmark for intermediate term bonds, and the 2-year note, a popular proxy for short term issues, so far this year.
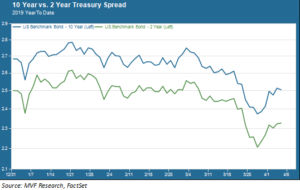
Two things jump out in this chart. First, the spread between these two bonds is relatively tight. Currently just 18 basis points (0.18 percent) separate the 10-year and 2-year yields. The second thing is that the relative movement of each yield has been remarkably similar: when one goes up so does the other, and vice versa.
But when you look at the total return performance in your portfolio you will notice that they are not the same, or similar, at all. For example, the total return for the iShares 1-3 year Treasury ETF (SHY) for the year to date as of April 4 was 0.88 percent. The total return for the iShares 7-10 year Treasury ETF (IEF) was 2.15 percent. Big difference! What gives?
Fortunately, the answer is very simple: it’s all about the math. Bond pricing is entirely and completely driven by math. It’s all about the rate of interest and the magnitude & timing of a bond’s periodic interest and principal payments. The math works such that, for any incremental change in interest rates, the price of a longer-dated security will change by more than the price of a shorter-dated security. So, to use the example of the 2-year and the 10-year bonds in the above chart, the same decrease in the rate of interest will cause the longer-term price to appreciate by more than the shorter-term one. That’s why, all else being equal, bonds with longer maturities (or effective duration, which is a measure by which we compare the relative effect of interest rate changes) have outperformed ones with shorter durations this year.
A Bond’s Purpose
If you knew that interest rates were going to go down for a long time then, all else being equal, you would want to position your portfolio to capture the benefits of longer duration. Conversely, if your vision of the future is one of rising rates, then you are interested in shorter-dated securities as a way to reduce interest rate risk. Of course, nobody can ever know for certain which way rates are going to trend (think, for example, of the Fed’s complete U-turn between its December and January meetings). The answer – or our approach, in any case – is to maintain a range of short to intermediate duration exposures with an eye to mitigating the risk of a sudden jump in rates.
Ours is a fairly conservative approach for the simple reason that for our portfolios, the fixed income portion is where you go for safety, not for outperformance. Bonds are for stability (predictability of the size and timing of income streams) and for cushion against the risks to which other asset classes – primarily equities – are exposed. And it is those riskier asset classes – again, not bonds – where we actively seek growth through capital appreciation.
The total size of our fixed income allocation may change – higher or lower as a percentage of total portfolio assets depending on our overall market and economic outlook. But you won’t find us aggressively chasing returns through active duration management, because that is not why we have bonds in the first place.