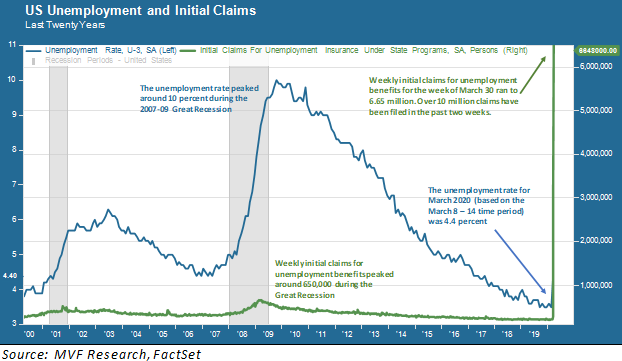
This week we got two different views on the unfolding crisis in the US labor market brought about by the coronavirus pandemic. The chart below shows two different measures of job losses. By looking at them in the context of previous economic growth and recession cycles we can understand the scale of what is likely to unfold over the coming weeks.

Past and Present
Let’s start with the most significant figure on this chart. That vertical green spike on the far right side does not look like it belongs with any other data point along the green line, but in fact it simply contains the last two weeks of data about initial unemployment claims: 3.3 million claims last week and 6.65 million claims this week. As the chart clearly shows, that number is unlike anything experienced in either the Great Recession of 2007-09 or the milder recession of 2001. It is the most dramatic labor market reversal since the government started keeping statistics back in the 1940s.
The second line in the chart, in dark blue, is the more familiar unemployment rate reported monthly by the Bureau of Labor Statistics. It’s a bit hard to see the March 2020 uptick on the far right because it runs into that initial claims trendline. While nowhere near as dramatic-looking, the increase in the unemployment rate from 3.5 percent last month to 4.4 percent this month is the most significant one-month uptick in unemployment since 1975.
The difference between these two metrics is a difference of past and present. The past, in this case, is the seemingly far-away time period of March 8 – 14, when the BLS data for the unemployment rate was compiled. The present, on the other hand, is the past two weeks of near-total shutdown in most of the country’s major economic centers. That’s why the initial claims chart is stratospheric while the unemployment rate is still within traditional norms. The past hasn’t caught up with the present. But it will have, when the next BLS jobs report comes out in early May.
Help Is On the Way…How Much?
It is important to understand that this is a very different set of circumstances in the labor market than the traditional economic down cycle. Normally, economic conditions start to deteriorate for whatever reason, and businesses start to gradually lay people off. That’s what was happening in those previous two recession periods seen on the above chart and the ones that came earlier. In the present case, we had an economy of continuing moderate growth and a healthy – indeed tight – labor market right up until a health crisis suddenly hit. So the spike in unemployment is not the result of an organic deterioration of general conditions. It is the result of a deliberate set of actions to improve the outcome of a health crisis. To use a health analogy, it is the equivalent of a medically induced coma to arrest the spread of the problem so as to return the patient to health. That’s what is happening now.
The question, then, is twofold. First, how many more weeks of these stratospheric unemployment claims are we likely to see? Second, how many of those lost jobs are going to come back, and in what time frame? While the answer to these questions depends on many varied factors for which we have at best incomplete information, one very important variable will be how swiftly and effectively the $2 trillion relief package passed last week can be implemented – and whether lawmakers can rise to the challenge again to augment that with additional sums widely agreed to be necessary.
Some relief will be available in the next few days: workers who qualify for unemployment benefits will get an additional $600 per week under the terms of the relief package. And other workers who would normally not qualify for benefits, such as freelance workers, will also be eligible. A $385 billion small business loan program is also part of the $2 trillion package and is intended to help troubled businesses buy enough time to refrain from completely eviscerating their payrolls. And the IRS will start mailing out $1,200 to individuals earning $75,000 or less starting April 9.
More Is Needed
The problem with the $2 trillion relief package, unprecedented as it is in size, is that it is not scalable to the magnitude of the layoffs that are occurring now and the growing evidence that the coronavirus pandemic will continue to overwhelm our healthcare system – including our fractious health insurance industry – for some time to come. Every one of those 10 million Americans filing for benefits is a person – a young person early in her working career, a married couple with two children to home-school during the school shutdown, a single mother with rent to pay, food to put on the table, student loans to pay off. These are the people whose employment creates the income that normally flows through our economy and keeps businesses operational and profitable. To avoid having that virtuous cycle break down completely, more relief is necessary to help them bridge the gap from here to the other side.
This crisis is challenging all of us in so many ways, but we are as determined as ever to manage our way through it. We continue working every day to diligently and prudently manage the assets entrusted to us. As always, we encourage you to reach out any time you have any questions or concerns.