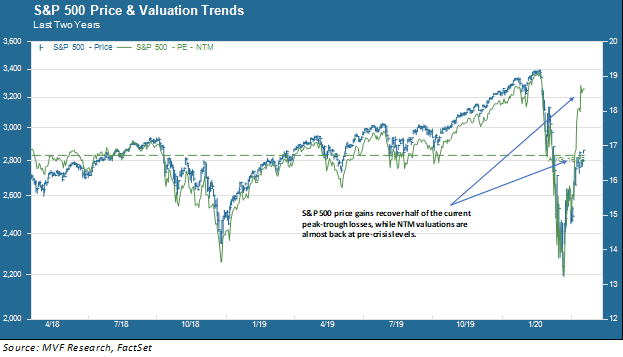
Ever since it cratered down to nearly 34 percent below its February 19 record high, on March 23, the S&P 500 has had itself a nice little bounce. As of the market close on April 16 the index was back to trading only 17.3 percent off the February high, thus recovering about half of its losses. What accounts for this giddy optimism among traders, given that we are still square in the middle of a health crisis and a resulting economic crisis where we still do not have a good sense of how long the bridge is from here to the other side, when things start to attempt a return to normal?
Part of the answer may simply be in how the mechanics of the market have evolved, and in particular the short term, speculative money that accounts for up to 70 percent of the total share volume on any given day. This evolution has given rise to a belief among a certain set of professional market observers (including ourselves) that, rather than being a diffuser of risk through the efficient and rational process of price discovery – which is what all the finance textbooks say is supposed to happen – the market today is actually an amplifier of risk. Consider the speed by which the S&P 500 fell during a span of just days in March. Even more so, consider how wildly the prices of investment grade bond ETFs went off the rails in that same time frame. Amplification, not diffusion, of risk. We don’t have time today to dwell in more detail about the economic problem this presents, but you will certainly be hearing more from us about it.
Reality Bites Back
Now the optimistic sentiment driving prices over the past several weeks has some hard data to contend with in the form of earnings, which are just starting to come in for Q1 2020 results. In the chart below you can see the S&P 500 price trend along with the P/E ratio for estimated next twelve months’ earnings.

To understand what should give investors pause in the above chart we need to understand the math of valuation ratios. It is quite straightforward: price is the numerator, earnings are the denominator. The P/E ratio goes up – i.e. valuations become more expensive – either with the numerator going up or the denominator going down or both. Right now “both” is the word of the day. To put it another way: valuations based on expected next twelve months’ earnings are very close to where they were before the coronavirus crisis hit. Moreover, as you can also see from the green line in the chart, valuations earlier this year were already very expensive relative to any time in the past two years.
Does that make any sense? At the beginning of this year the consensus forecast of securities analysts who make these forecasts for a living predicted that S&P 500 earnings would rise by about 10 percent in 2020. That forecast has been revised down, and now earnings for the year are expected to fall by 12 percent. That’s what accounts for much of that spike in valuation ratios. But given what we know now – and perhaps more importantly what we don’t know now about demand and supply variables in the economy for the next year – does it make sense for valuations to be at the same giddy levels they were at before anyone even knew where Wuhan, China was?
Now For the Hard Data
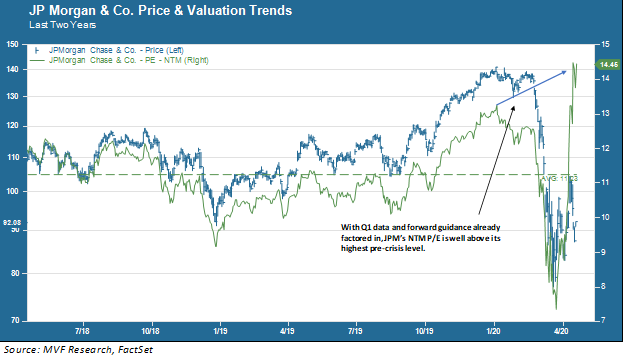
And that chart doesn’t even fully do justice to how fragile these valuation spikes appear. As of today less than 10 percent of companies on the S&P 500 have reported their Q1 earnings. So the estimates that make up that P/E trend line have only been partially incorporated into the overall outlook. Now consider below a similar chart showing one company – JPMorgan Chase – that already has reported its Q1 earnings.

Here you see what happens when projections are updated to account for the company’s latest take on their year-ahead prospects. Many companies, including JP Morgan, are not giving the same specific detail on their earnings outlook as they normally do – because of how foggy the view is. But Jamie Dimon, the JPMorgan CEO, was blunt in his expectation of an extremely severe recession in the months ahead and uncertainty as to what the recovery will look like on the other side. When analysts work these expectations into their valuation models, what results is the kind of stratospheric P/E ratio you see in the chart above.
Collectively, investors are by nature a bullish lot. It’s natural – you don’t invest your hard-earned money into the market because you think the world’s on a permanent road to nowhere. So it has not been entirely unsurprising to watch the sentiment evolve over the past couple weeks, looking to hang its hat on any piece of news suggesting that things may be improving. We certainly are cheering on every iota of success coming out of early clinical trials for vaccines and other drugs to fight this virus, and hoping that we will see another round of fiscal relief to help households and businesses bridge the gap between here and the other side of the crisis. But we also believe there will be many hills to climb before we get there. For now, valuations suggesting that we can start acting as if all is normal again are, in our opinion, way too premature.