After a few days of fairly listless trading, US equity markets took a deep dive late in the day on Thursday; protective cover, perhaps, for those fearing a hotter than expected inflation report on Friday morning when the Bureau of Labor Statistics was due to release the May Consumer Price Index report. That defensive impulse would seem to be validated, as the numbers for both headline and core (ex-food and energy) inflation did come in ahead of expectations.
The CPI report is the last piece of hard data members of the Fed’s Open Market Committee will take into their monetary policy meeting next Tuesday and Wednesday. That meeting is widely expected to result in another increase of 0.5 percent in the Fed funds target rate, with another one to follow when the FOMC meets again in July. As we noted in our commentary last week, the big question market participants have been debating in recent weeks is whether economic conditions support a “peak Fed/peak inflation” narrative that would imply a more subdued path for rate hikes following the June and July measures.
Today’s inflation report suggests (as we also opined in last week’s commentary) that it may be too early to bake peak anything into the cake. But it also brings into focus a broader question: what can the Fed actually do about inflation, and what are its limits?
Groceries, Gas and Everything Else
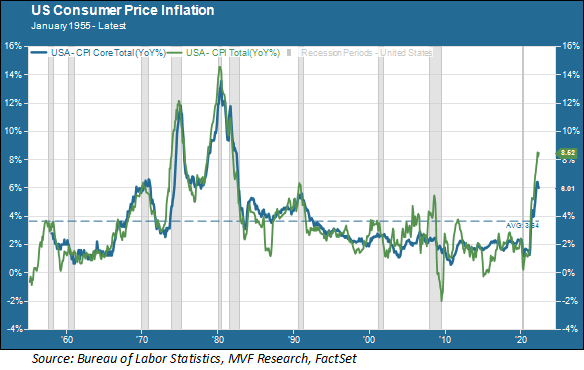
The chart below shows the path of headline and core inflation in the US from 1955 right up to this morning’s CPI report. Headline inflation (i.e. all categories) is represented by the green line and core (again, excluding the volatile categories of energy and food) is in blue.

You will notice that in some periods (most notably during the high-inflation era from 1968 to 1982) headline and core inflation move more or less in tandem. In other periods, particularly during the first decade of the 21st century, there was a fairly wide dispersion between core and headline. This was a period which included a commodities supercycle related to China’s rise as an economic power during the early-mid 2000s, and then a bust in energy and other commodity prices following the financial crisis and recession of 2008 (and again when energy prices collapsed in 2014). During these periods you can see the green line (headline CPI) deviating markedly from the blue core trend.
When the Fed talks about fighting inflation it is important to understand that it is talking about core inflation. Essentially what the central bank is saying is that it does not have tools available for controlling what you pay at the grocery store or the gas pump – those prices are driven by supply and demand forces happening all around the world that are not going to change much when US interest rates go up or down. What the Fed hopes is that by raising rates it can influence consumer demand in such a way as to bring down price levels for a broad range of goods and services outside those two volatile categories. The trick, of course, is to dampen demand by just enough to bring down prices without choking off growth entirely and precipitating a recession.
Supply Side Woes
So what does all this mean for the present period? If you look at the headline and core inflation trends for the past year, you can see headline and core inflation rising together, though with a decisive move higher by the headline number in the report that came out today (8.6 percent year-on-year rise in headline CPI and 6.0 percent jump in the core number). That is largely due to the resurgence in both food and energy prices over the past 30 days, a large amount of which is due to the ongoing war in Ukraine. Russia is the world’s largest grain exporter, and Ukraine is the fifth-largest. Russia’s blockade of the Black Sea, preventing Ukrainian grain exports from reaching their destinations, is pushing many countries in Africa and the Middle East into an acute food crisis and a looming famine. True to its stated policy, there is nothing the Fed can do to address this crisis.
There is another problem, though, as it relates to the various categories that make up core inflation, that is also outside the Fed’s purview. Global supply chains, battered by the effects of the pandemic and the insatiable demand for goods that followed, are a major impediment to a normalization in prices. China continues to be a source of instability with its monomaniacal zero Covid policy. Other major supply chain hubs such as Vietnam are also struggling to resume full-capacity operations. The shortage in semiconductor chips continues to affect prices for a wide variety of products including new and used automotive vehicles. Prices for used cars, to give one example, are 16.1 percent higher than they were a year ago according to today’s report.
The equity market already seems to be moving on from “peak inflation/peak Fed.” As always, though, we are more interested in what the bond market will have to say. Although credit risk spreads have trended up recently, the spread between 10-year Treasuries and low-investment grade corporate bonds is still below its three-year average. Five-and ten-year breakeven rates suggest that longer-term inflationary expectations have not broken out of the barn, which in turn implies that a decent degree of confidence remains in credit markets that the Fed will get the job done. That remains our default thinking as well – but we will continue to pay very close attention to developments in those things the Fed cannot control.