The Glass Is Half-Empty, and also Half-Full
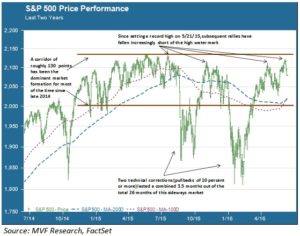
We all know the old trope: optimists see the glass as half-full, pessimists as half-empty. This year – and indeed for more than a year before that – the Cassandras and the Pollyannas seem to be as close to equilibrium as possible. Since November 2014, the S&P 500 has traded in a relatively narrow corridor between a floor of 2000 and a ceiling of 2130 – a spread of about 6.5 percent. That’s a 26-month sideways market, punctuated twice on the downside with the technical corrections of August 2015 and January 2016, while thus far failing several successive attempts on the summit price of 2130 reached in May 2015.

We can look at this sideways market through the lens of that metaphorical glass of water. On top you have the “valuation ceiling”, where the glass-half-empty crowd stands guard. By traditional metrics such as price-to-earnings (P/E) and price-to-sales (P/S), stocks are more expensive than they have been at any time since 2003. If you are not fully invested in the market, goes the thinking up here, what’s the point of taking on exposure at these rich price levels? Earnings growth has been negative for four quarters in a row and is projected to be modest for the rest of this year. The overall US economy is doing okay, but other parts of the world from Europe to China and Japan are question marks at best. A clear upside catalyst seems to be missing.
At the bottom of the corridor range is the “policy floor”, where the glass-half-full folks congregate. Look at those two corrections in August and January, say the Pollyannas. Lots of signals flashed red in both cases – the VIX “fear gauge” went crazy, intraday spreads widened and prices crashed through technical support levels like long-term moving averages. Yet – as with literally every pullback subsequent to the 2008-09 market crash – the damage was relatively contained and a V-shaped recovery got prices back into the corridor fairly quickly.
There may be any number of plausible reasons why the corrections bottomed out where they did. But policy – namely, the willingness of central banks to do anything in their power to prevent asset markets from falling too far – is the most likely explanation for why nothing that has happened in the world for the last eight years has had more than a fleeting impact on asset prices. Why go ultra-defensive if the Fed has your back? What makes next time different from last time, and the time before that, and…?
History would tell us that this sideways market will, at some point, turn into a sustained directional trend one way or the other. But now may not be that time. The Cassandras at the valuation ceiling and the Pollyannas at the policy floor make near-equally compelling arguments, in our opinion, as to why the breakout could be forestalled for some time longer.