
News & Insights

This is not stagflation! Or so Jay Powell insisted, during the Wednesday press conference this week following the Federal Open Market Committee meeting that, as widely expected, kept US policy rates on hold at present levels. Stagflation was a thing we had to deal with, very harshly, in 1979, when turmoil in Iran was just one of many factors fanning the flames of consumer inflation. Paul Volcker’s Fed had to raise the Fed funds rate, ultimately to as high as 20 percent, to corral inflation and reinvigorate the economy’s potential to grow. Anything less than the experience of 1979-80, in the world according to Jay Powell, does not merit the term “stagflation.”
Wrong Direction
We’re not in 1979, that much is true. But we do have the two components of that word – the “stag” and the “flation,” if you will, both moving in the wrong direction. On Wednesday we got a report showing wholesale prices in February moving considerably higher than economists had been expecting – and that report reflected activity before hostilities in the Middle East broke out at the end of last month. Inflation is moving higher while the jobs market is weakening (and Powell and his Fed colleagues believe that actual conditions in the labor market are worse than the already-bad numbers in the jobs reports).
So how is all this affecting conditions in the bond market? The chart below shows the one-year trend for Treasury yields at the two and thirty year maturities, along with oil prices, noting the before-and-after conditions around the Middle East war.
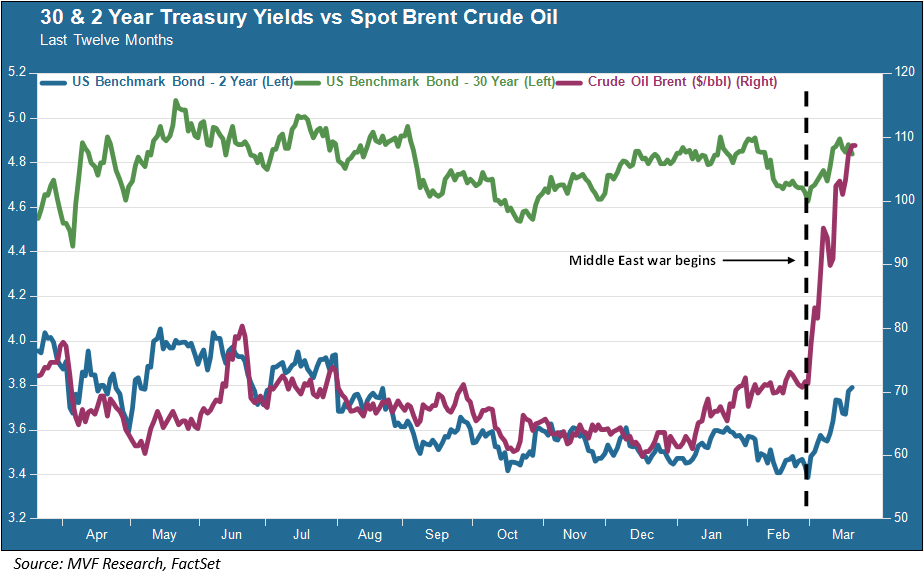
Since the attacks began on February 28, the 2-year Treasury yield (the blue line on the chart) has jumped from around 3.4 to 3.8 percent, a percentage move of around 12 percent. The 30-year yield (green line on the chart) has moved from around 4.63 to as much as 4.91 at the same time, a more modest but still solid percentage gain of about 5.8 percent. Remember that bond yields move inversely to prices, i.e. higher yields mean falling prices. At first glance this might seem counterintuitive. In a risk-off market environment, like the present, Treasuries are supposed to be the refuge, the safe haven where capital flows in search of security. The problem, of course, is that this is a risk-off environment in which at least several among all the possible outcomes have inflation settling in for a more structurally elevated duration, thus making present nominal yields look relatively unattractive.
Strains on the Upside
The problem with writing these commentaries in the middle of a very fluid and rapidly changing environment is that events can move faster than the hand can type (yes, we do our pieces the old-fashioned way, without the divine intervention of ChatGPT). As of mid-morning Friday, yields at both the short and long ends of the curve are pushing higher without much apparent hedging sentiment to pull them back. The 30-year is at 4.94 as this sentence is being typed, already some six or seven basis points up from where it started the day. Although, as the above chart will show, the 30-year yield has been well above this level on a handful of occasions in the past year, so we would still characterize the market as bent but not broken, with at least some safe haven muscle memory to offset the inflationary push.
The short end of the curve is relatively easy to explain: taking their cues from the Fed and from what they see around them, bond investors are backing off from the previous assumption of one or more rate cuts this year (even though the median expectation from the Fed itself, in the Summary Economic Projections released on Wednesday, still calls for one rate cut in 2026). Market yields are adjusting accordingly.
At the long end, where rates are influenced by a wider variety of variables than just monetary policy decisions, the capitulation could start in earnest if the 30-year moves significantly north of five percent. That would, in our opinion, be a high-probability outcome if the consensus around the war converges on the assumption of no end in sight for the disruption to energy markets. This week’s bombing of critical energy infrastructure sites in the region has pushed sentiment towards that position. It’s still far short of a universal consensus, but it is also making the best-case scenario of a quick and relatively painless end much less likely.