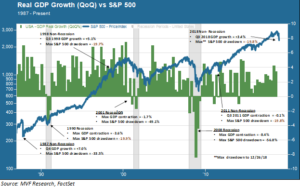
If you are a regular reader of our weekly column you may recall a somewhat nitpicky piece we penned back in August called “What Record Bull? where we took issue with the much-trumpeted theme in the financial press that week about the apparent new longest-ever bull market. It wasn’t, as we took pains to point out. During the recession of 1990 the S&P 500 came ever so close to that 20 percent bear market threshold, surrendering 19.9 percent from its previous high. But it didn’t cross over the threshold, leaving the bull market that began in December 1987 fully intact until the dot-com implosion of 2000.
Market Corrections Don’t Repeat, But They Do Rhyme
And so, the events of this week. On December 24 US stocks had their worst Christmas Eve ever, to cap of the worst (to then) December since the dark days of 1931, in the middle of the Great Depression. At the end of that trading day the S&P 500 was down 19.8 percent. Just like 1990 – and a handful of other occasions, as we will illustrate in the chart below – the broad-based US large cap index approached, but did not cross, the threshold into bear territory. “Just shy of 20 percent,” be that 19.8 or 19.9 or 19.7, seems to be a regular visitor to market correction events.

Sometimes this just-shy-of-bear phenomenon happens during a recession, as in 1990. Sometimes it happens when the economy is holding up but other factors muddy the waters, as in 1998 (Russian debt default and LTCM collapse), 2011 (Eurozone crisis) and now 2018 (political uncertainty, trade war and whatever else). And there are, of course, the exceptions, arguably the most striking being the one day in October, 1987 when the market lost 22 percent in the course of one trading day. The two bear markets of 2000-02 and 2007-09 witnessed both recessions and specific financial crises, as we pointed out in a column several weeks ago.
The Importance of Silly Numbers
These thresholds – 10 percent for a correction, 20 percent for a bear market – are not meaningful in and of themselves. An investor’s mood is unlikely to improve much if you tell her that her stock portfolio is down ONLY 19.9 percent rather than 20.1 percent. As silly as these arbitrary definitions are, though, they do matter. They matter because the preponderance of trading volume out there on any given day is wired to trade off them. Think about what happened on December 26, the next trading day after Black Christmas Eve. Twice during the morning session the market tested the 19.8 percent support level, and then it surged in an insane rally to close the day up more than four percent.
A rational person might ask, what happened in the world to suddenly make the projected future cash flows of S&P 500 companies that much less, or that much more, valuable in such a short period of time. The answer is: absolutely nothing. These movements are all noise, no signal. More than three quarters of the total trading volume on any given day is driven by algorithms programmed to react to specific trigger events. It doesn’t “mean” anything that sellers put the brakes on as prices converge on that minus 20 percent support threshold. That’s just a particularly prominent trigger, and it was busy at work on both 12/24 and 12/26.
Spin the Wheel
Trying to game the system in these short term bouts of spasmodic price lurches might be fun for people who enjoy rolling the dice. But since the likely payoff is more or less the same as rolling actual dice on an actual craps table – why not just head out to Las Vegas and do exactly that, with a nice meal and fun entertainment afterwards? A prudent long term investment strategy, on the other hand, blocks out the noise to the extent possible and focuses on the factors that matter for each investor’s particular goals around growth and risk mitigation.
We wish our clients and friends a very happy New Year, with joy and good health in the year ahead.