It’s a new calendar year, but markets continue to party like it’s late-2016. Remember Murphy’s Law? “If something can go wrong, it will” goes the old nostrum. U.S. equity markets, in the pale early dawn of 2017, exhibit what we could call the inverse of Murphy’s Law. “If something can go right, it will!” goes the happy talk.
Happy Talk Meets Sales & Profits
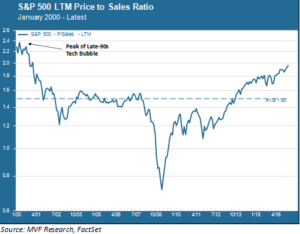
We’re about to get an indicative taste of how far these rose-tinted glasses will take us through the next twelve months. Earnings season is upon us. Analysts expect that earnings per share for last year’s fourth quarter will have grown by 2.81 percent from a year earlier, according to FactSet, a market research company. Stock prices grew by a bit more than that – 3.2 percent – over the same period, so valuation measures like price to earnings (P/E) and price to sales (P/S) edged up further still. In fact, the price to sales ratio is higher than it has ever been since the end of 2000, and within striking distance of the nosebleed all-time high reached at the peak of that bubble in March 2000. The chart below illustrates this trend.

Price to sales is a useful metric because it shines the spotlight on how much revenue a company generates – from sales of its goods and services – relative to the price of the company’s stock. We inhabit a world where global demand has been persistently below-trend for most of the time since the 2007-08 recession. Weaker demand from world consumer markets, along with the added headwind of a strong dollar, has impeded U.S. companies’ ability to grow their sales from year to year, and that in turn helps explain why stock prices have run so far ahead of revenue growth.
Knock Three Times on the Ceiling
While price to sales is important, investors generally tend to place more emphasis on the bottom line – earnings – than on the revenue metric. Some investors focus on past results, such as last twelve months, or full-cycle measurements like Robert Shiller’s Cyclically Adjusted Price to Earnings (CAPE) ratio. Others believe that forward-looking measures are more useful and pay closer attention to analysts’ consensus estimates for the next twelve months. By any of these measures the market is expensive. The Shiller CAPE ratio, for example, currently stands at 28.3 times. That’s higher than it has been any but two times in the last 137 years (yes, one hundred and thirty seven, that is not a typo). The CAPE ratio was higher in September 1929, before the Great Crash, and again in March 2000 before that year’s market implosion.
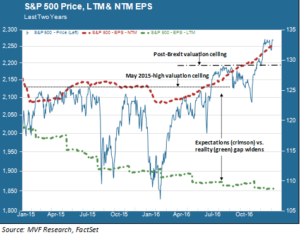
While CAPE is a useful reality check on the market, neither it nor any other metric is necessarily a useful timing tool. There is no reason to believe that the so-called “Trump trade,” based largely on Red Bull-fused animal spirits, will end on a specific date (all the silly chatter of the “sell the inauguration trade” aside). What particularly interests us as earnings season gets underway is whether – and this would be contrary to the trend of the last several years – the earnings expectations voiced by that consensus outlook actually squares with reality. Consider the chart below.

There’s a lot on this chart, so let’s unpack it piece by piece. Let’s start with the horizontal lines depicting two “valuation ceilings” which, over the past two years, have served as resistance levels against upward breakouts. The first such ceiling is defined by the S&P 500’s high water mark reached in May 2015. The index challenged that high several times over the next 14 months but consistently failed to breach it. Then Brexit happened. The post-Brexit relief rally in July 2016 powered the index to a succession of new highs before topping out in August. It then again traded in mostly sideways pattern through early fall up to Election Day. Of course, we know what happened next.
Hope Springs Eternal
Now we come to the second key part of the above chart, and the one to which we are most closely paying attention as we study the forward earnings landscape. The thick green and red dotted lines show, respectively, the last twelve months (LTM) and next twelve months (NTM) earnings per share for the S&P 500. In other words, this chart is simply breaking the P/E ratio into its component parts of price and earnings, using both the LTM and NTM figures.
So how do we interpret these LTM and NTM lines? Take any given day – just for fun, let’s say December 10, 2015. On that day, the NTM earnings per share figure was $125.79. If we could travel back in time to 12/10/15 and talk to those “consensus experts,” they would tell us that they expected S&P 500 EPS to be $125.79 one year hence, on December 10, 2016. But now look at the green line, showing the last twelve months EPS. What were the actual S&P 500 earnings in December ’16, twelve months after that $125.79 prediction? $108.86 is the right answer, quite a bit lower than the consensus brain trust had expected!
Why is this Kabuki theater of mind games between company C-suites, securities analysts and investors important? Look at the NTM EPS trend line, which has gone up steadily for the last year even as real earnings have failed to kick into growth mode. Right now, those gimlet-eyed experts are figuring on double-digit earnings growth for 2017. Double digit earnings growth would offer at least some justification for those decade-plus high valuation levels we described above. Is there a chance that reality will fall short of that rosy outlook? That is the question that should be on the mind of any investor at all concerned about the fundamentals of value and price.
Global demand patterns have yet to show any kind of a significant pick-up from recent years, though the overall economic picture continues to improve at least moderately. And the headwinds from a strong U.S. dollar do not appear to be set to abate any time soon. As we said above – and have said numerous times elsewhere – none of this means that the market is poised for a near-term reversal. Animal spirits can blithely chug along as long as there is more cash sitting on the sidelines ready to jump back in, or a sense that there is still a “Greater Fool” out there, yet, to come in and buy.
But pay attention to valuation, and specifically to whether double-digit earnings truly are just around the corner or yet another case of hope flailing against reality.