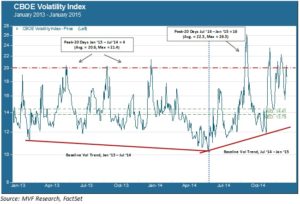
Volatility is back. For most of the past two years we have enjoyed a comfortable world of low risk & high returns. Stocks rose steadily with little drama save for an occasional pullback in the neighborhood of 5% with an immediate V-shaped recovery. This environment started to change last fall. Baseline volatility began trending up from its summer lows, and those brief Alpine spikes that look so dramatic on vol charts occurred with more frequency. The chart below illustrates the shift in the volatility landscape over this period, using the CBOE VIX index as a risk proxy.

Measuring Fear (1): Baseline (Normal) Volatility
We look at two things when evaluating volatility trends. First is the baseline trend. This is a measure of “normal” volatility – where it trades most of the time when the market isn’t collectively freaking out about something. The chart above shows that baseline vol trended flat to lower for most of the nineteen months between January 2013 and July 2014. Through early to mid-summer last year the VIX trended down close to historical lows before reaching a trough in early July. Since then the trend in baseline vol has been upward and gathering steam. Even through last year’s turbulent October pullback, baseline vol was not far from – and mostly below – the two year average of 14.4. But it has remained firmly above that average throughout the entire month of January.
Measuring Fear(2): Peak-20 Days
The other metric we consider is peak performance. These are the abnormal days when something – be it a piece of unexpected news or a rogue algorithm or the popular delusions of crowds – sends volatility soaring. We call these “peak-20 days” when the index under observation is the VIX, referring to a closing price of 20 or higher. What we care about are (a) the frequency of peak-20 days; and (b) the magnitude of the peaks. Again, the above chart shows two distinctly different climates. There were only four peak-20 days from the beginning of 2013 through midsummer last year. There have been sixteen peak-20 events in the seven months since. January looks set to establish a new high mark. If the VIX stays above 20 through the 1/30 close today, it will be the seventh peak-20 day for the month, or more than 30% of total trading days. At the same time, the highs are higher. The peak of 26.3 reached last October was the highest since June 2012, just before Mario Draghi bailed out the Eurozone with his “whatever it takes” pronouncement.
Vol Today, Gone Tomorrow?
Volatility is a notably flighty metric; it can appear out of nowhere only to be gone in the blink of an eye. But there are some valid reasons why the current bout of risk may stick around for longer than it has in recent times. There is also a reasonable difference of opinion as to whether higher volatility implies a down year for stock markets or a potential “melt-up”, with money coming off the sidelines for a last, frenetic grasp at returns before this secular bull trend comes to an end.
On the negative side we have the current OK Corral square-off between the Fed and the bond market. If the bond market is right – if current yields are a good indicator of intermediate term price and growth trends – then today’s volatility picture could portend tears for traders. On the other hand, European QE, an export tailwind for euroland exporters and a low rate-led recovery in emerging markets, coupled with more or less okay headline numbers in the U.S., could be the recipe for a last hurrah – party like it’s 1999! Either way, it may time to learn to love the vol.