16,000. 4,000. 1,800.
It’s the harmonic convergence or planetary alignment– pick your divine sign – of the capital markets. The three most widely tracked U.S. equity indexes are all flirting with these perfect round numbers, these Platonic metrics of stock market performance. The Dow Jones Industrial Average closed above 16,000 for the first time on Thursday, while the S&P 500 has moved above 1,800 in intraday trading, and the Nasdaq Composite is closing in on 4,000. The last time Nasdaq saw 4,000 was coming from the other direction, as it fell from the 5,000 level it briefly grazed at the height of the tech bubble in 2000.
Perception Becomes Reality
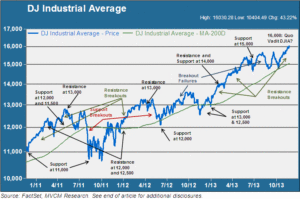
What’s with the round numbers fixation? It’s just a number, right? Actually, no, it’s not just a number. Sometimes perception has a way of becoming reality. Consider the following chart, which shows the price trend of the DJIA over the past three years.

The chart shows a fascinating repetition of support and resistance levels, all of which coincide with those perfect round whole numbers. Case in point: the Dow reached 12,000 in the first quarter of 2011, after a breakout above the previous support level of 11,000. It had trouble breaking 12,500 (an intermediate round number) but also managed to find intermediate support above 11,500. Then it broke through to rally up close to 13,000, which then became the next resistance level. This pattern of support, resistance and eventual breakout rally or pullback continues all the way to the present.
In fact, today is a textbook day in the annals of the round number fetish. As we write this the Dow is about flat for the day, holding on above the 16,000 mark it reached yesterday. Meanwhile, the S&P 500 is juuuuust below 1,800, trying to make the most of a generally upbeat trading day. As for the Nasdaq, it would simply take an afternoon trading surge to propel it from its current intraday level of 3,985 up above that magic 4,000 level. Perhaps it will be there by the time you read this.
Traders of a Feather Flock Together
The only reason why there is anything special about the round numbers is because traders (of both the human and algorithmic variety) make them special. Professional traders for the most part have a day-to-day mentality. They will take profits, hedge their bets and re-up the ante in measured steps. When the market approaches one of these round number inflection points, the general sentiment will be to stay one’s hand for a bit, maybe realize some profits (or cut some losses), and trade cautiously ahead of the next breakout. If one trader does this, it’s nothing special. If lots of traders do it, it becomes a regular feature of the market.
From 16,000 to Where?
Of course, seeing a pattern of resistance and support is one thing; figuring out where the market’s going to go next is quite another entirely. You can see from the chart that not all round number events are of equal duration or magnitude. For example, when the Dow reached 14,000 in the first quarter of this year it didn’t pause for very long, a couple weeks or so, before breaking above resistance to rally up to 15,000. On the other hand, it took more than a year for the index to finally shake the 12,000 support level for once and for all.
We have to weigh several factors that could be key influences in the weeks ahead. We’re heading into the last month of the year, which is often a momentum month that amplifies whatever trend is currently underway. However, the major indexes are all comfortably above 20% for the year to date, so in the absence of new news there may be a limit to how much farther a year-end “melt-up” can go. There is also quite a bit of chatter among industry pundits about current price levels relative to earnings prospects for next year. We shall have to see what this round number inflection point holds – and whether it holds in the same way for 16,000, 4,000 and 1,800.