Once upon a time, there was a quaint little thing called the “risk frontier,” a staple of textbooks teaching the theory and practice of investment management. Stocks for growth, bonds for safety was the underlying mantra. You put a mix of equities and high-quality fixed income securities into a portfolio based on your goals for growing your money (equities) and at the same time preserving your capital against periodic volatility (bonds). It’s called the risk frontier because you can plot it in a linear fashion on a 2-axis risk and return graph: lower risk, lower return for the safety plays, moving out sequentially to lower-grade bonds, preferred stock, blue chip common stock, emerging markets, venture capital – you get the idea.
Wild Times At The Two-Year
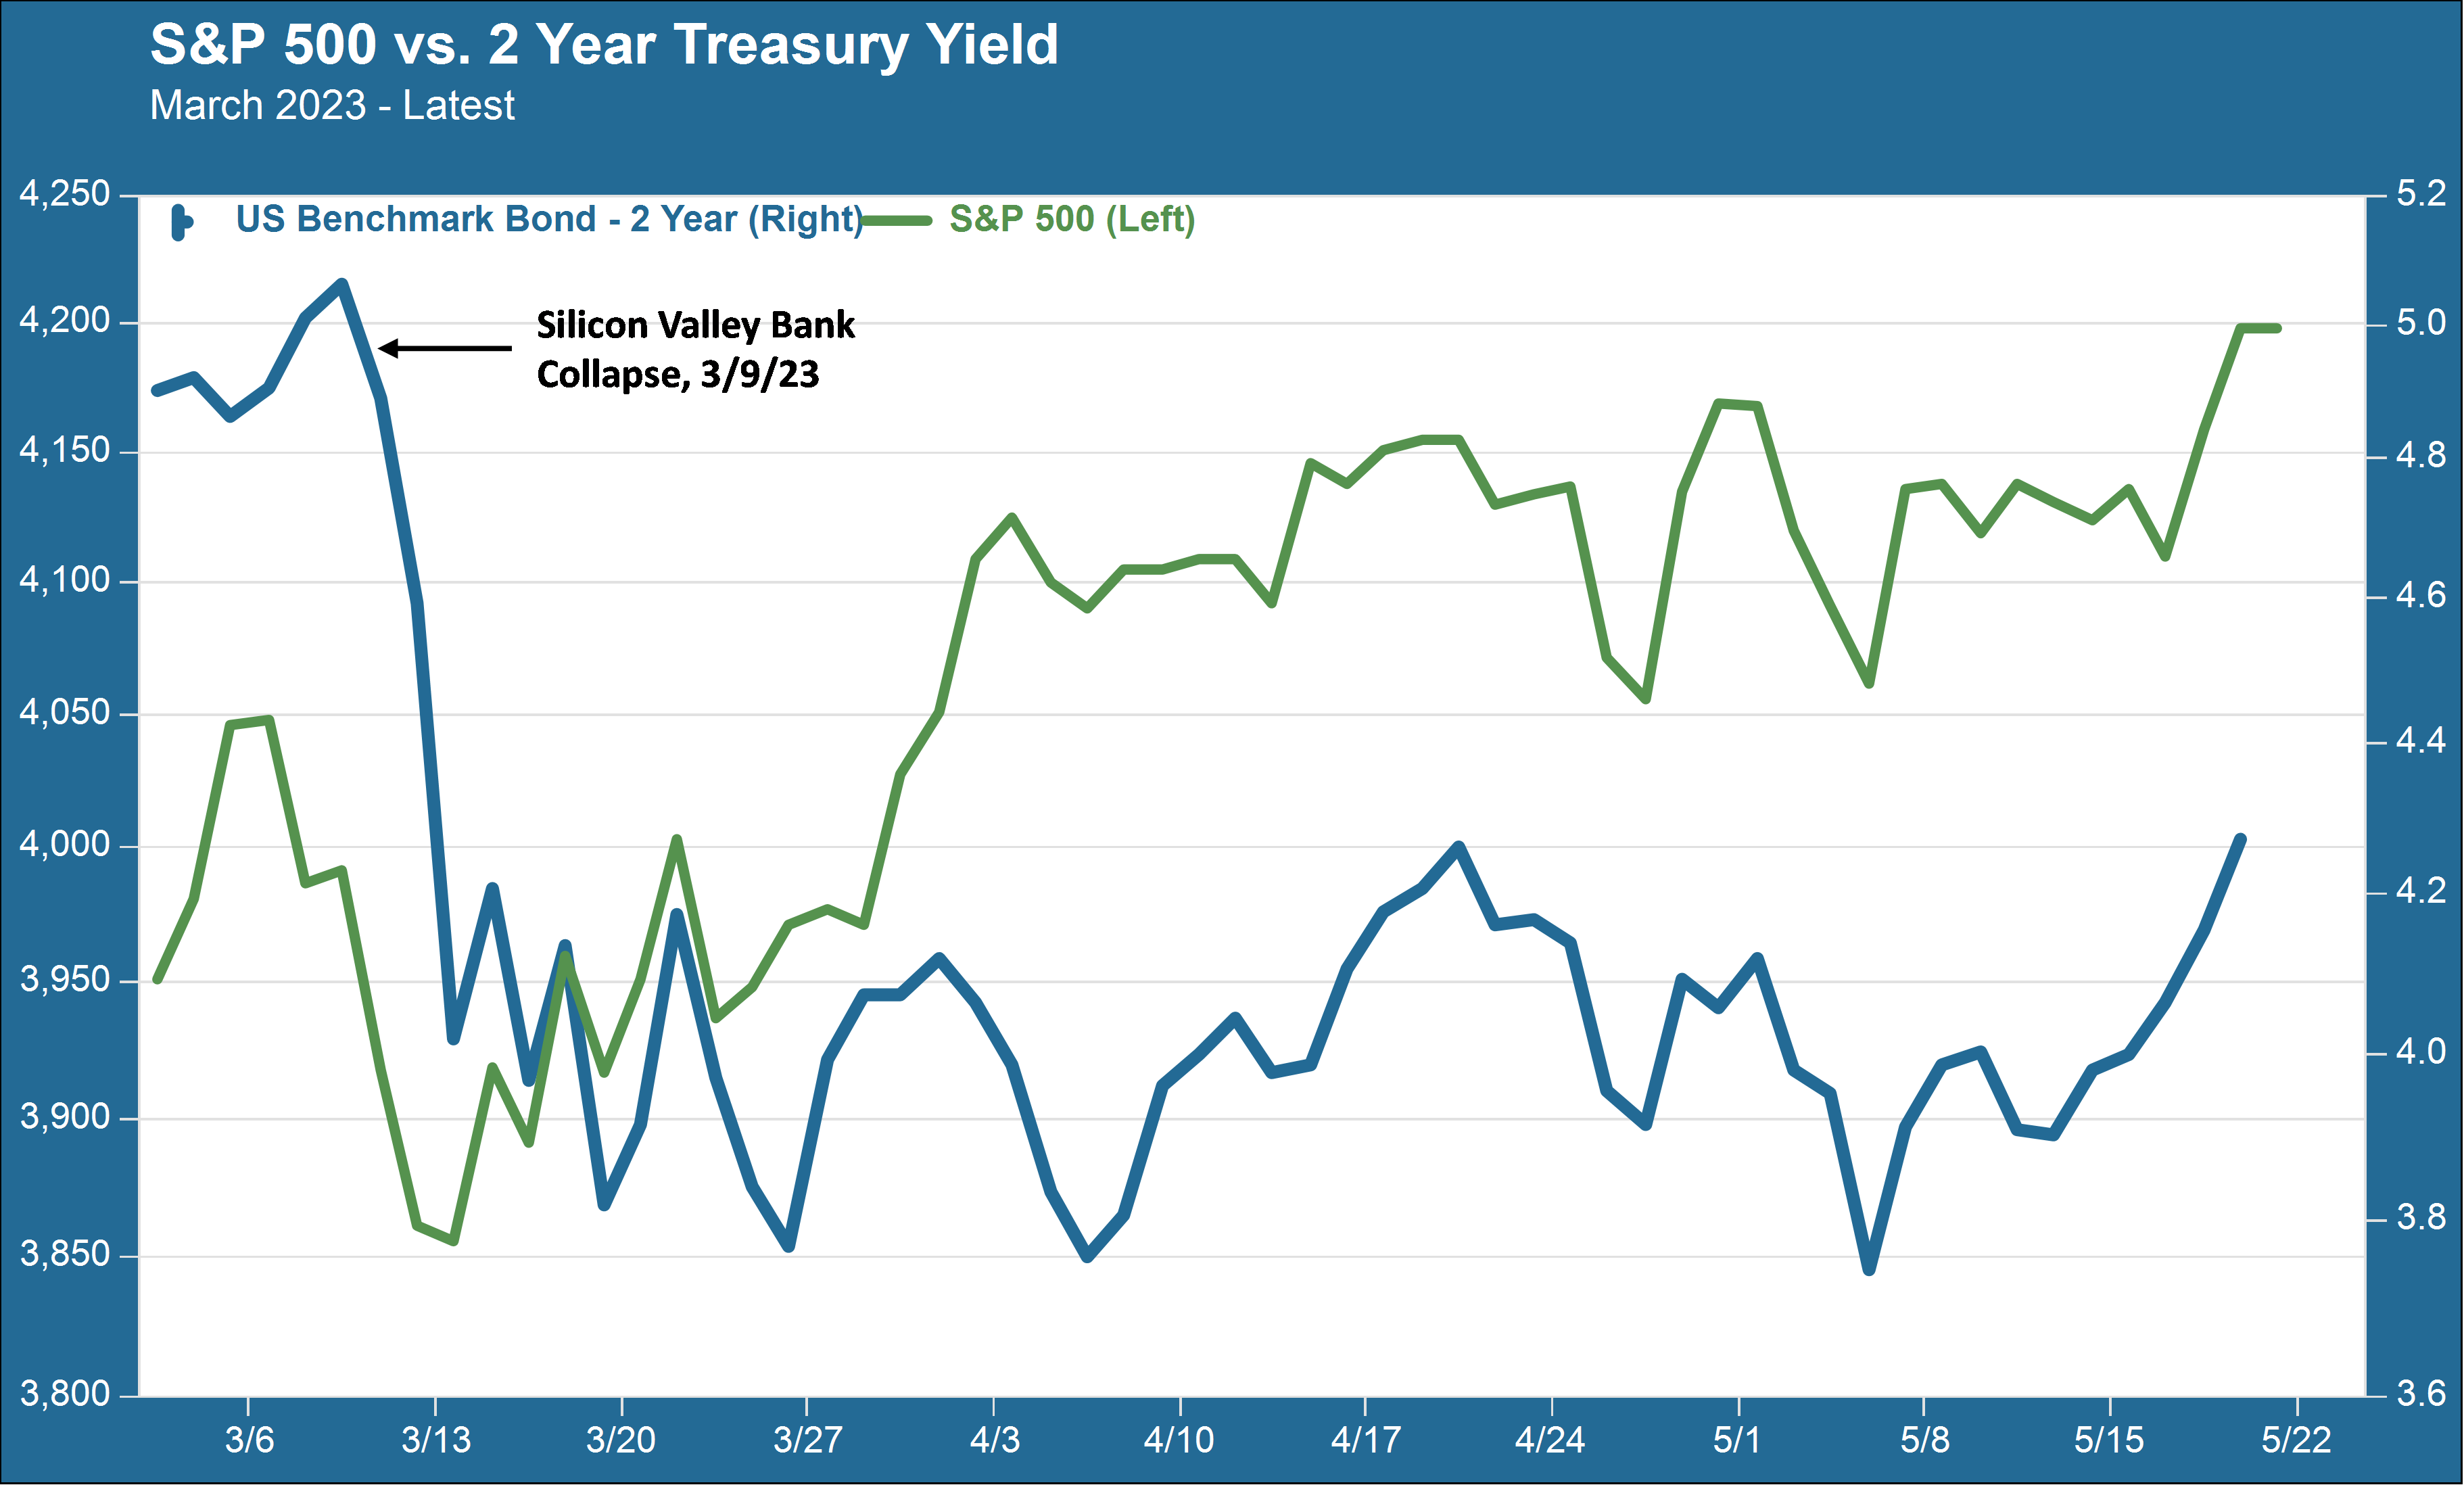
With that in mind, consider the chart below and see if you could figure out (without looking at the descriptive legend) which of these two lines represents the S&P 500, an index of large-cap US common stocks, and which one represents the yield on the two-year US Treasury note, a security backed by the full faith and credit of the US government that otherwise goes by the name “risk-free rate.”

They both bounce around a bit – right? But the blue line seems to be bouncing around quite a bit more, from that big plunge back in March to some outsize sideways lurches and then to a big jump upwards in the past several days this week.
The blue line, of course, is the two-year Treasury yield. Trading in this particular maturity of Treasury securities has been particularly frenetic since the collapse of Silicon Valley Bank back in March (the event that precipitated that massive plunge in the yield). This is more than a little strange. The two-year is sort of an endpoint for what we think of as the “short end” of the yield curve. The short end is supposed to be influenced by one factor above all others – the interest rate policy set by the Federal Reserve and represented most directly by the Fed funds rate, an overnight rate that the Fed directly targets through its open market operations. The Fed funds rate is currently set in a target range of 5.0 – 5.25 percent, following the most recent rate hike announced earlier this month. The Fed funds rate did not come down as a result of the banking sector troubles following the SVB collapse. But other short-term rates did, and they’ve been jumping up and down in a more or less sideways pattern ever since (prior to this most recent week, which we’ll come to in a minute).
Stocks For Safety?
Meanwhile, conditions in the equity market have been unusually placid. A report from Bloomberg News this morning noted that the S&P 500 is so far having its quietest quarter since 1993. Yes – there was a bit of a pullback immediately after the banking crisis, but things calmed down quickly when it became apparent that SVB and the small number of other failing banks was not shaping up to be a full-scale financial crisis in the manner of 2008. Part of the recent strength in equities has to do, in fact, with the big plunge in interest rates. Growth-oriented stocks, which are more sensitive to changes in interest rates due to the more variable nature of their cash flow models, have led the recent rally (in particular, a very small number of mega-cap tech stocks). Resilience in these parts of the market have proved more than adequate to offset the ongoing jitters that affect stocks in the banking sector.
Congress And The Fed
This week’s outsize moves in Treasury yields suggest that the mostly sideways pattern of the past couple months may be giving way to a more sustained directional move upwards (though this is of course by no means certain). There seem to be two factors at play.
First, we think it may finally be beginning to dawn on the bond market that a Fed “pivot” – a near-term reversal of monetary policy with a move to cutting rates – is extremely unlikely. We have been banging on about this for weeks now – after the SVB collapse, bond yields reset at levels suggesting that the market was pricing in some 0.6 percent or so in rate cuts before the end of 2023, possibly beginning in June. Well, June is just around the corner, and the only Fedspeak we’re hearing these days is either pause and hold (Powell, at the May FOMC press conference) or even one more rate hike when the Committee meets in several weeks from now. We have been perplexed by the market’s sticking fingers in its ears and shouting “la-la-la” every time Powell or another Fed figure says that no rate cuts are on tap for 2023.
Then there is Congress, and the always-unfortunate political theater of the debt ceiling. It remains highly unlikely that a default will occur when the Treasury runs out of money on or sometime shortly after June 1 (according to Treasury Secretary Janet Yellen). On the other hand, June 1 is closer today than it was two weeks ago. It should not be surprising that some amount of concern about a default is showing up in bond yields – this is particularly true of the 1-month yield, since the 1-month now comes due in the second half of June, which means either a new debt ceiling is in place or the paper is worthless.
On the equity side, though, any concerns about a debt ceiling debacle are not showing up in recent price movements. Quite the contrary. We are sometimes guilty of making sport of the stock market’s “common wisdom.” This time, we’re hoping that wisdom is correct and on target.