Well here we are, at the start of a year which should live up to that old Chinese proverb “may you live in interesting times.” Just a few hours into the second trading day of the year we have seen the S&P 500 give up most of the substantial gains the index racked up on Thursday. Yesterday’s optimism over trade talks progression gave way to fears over escalating hostility between the US and Iran after an overnight air strike took out the regime’s top military commander (who was in Iraq at the time).
Neither Thursday’s cheer nor Friday’s fear will likely persist much beyond a day or two of market impact. But the short-term volatility offers a striking contrast to the slow, steady grind upwards that characterized the last two months of 2019. After last year’s rousing performance there are more than a few skeptical voices in marketland wondering how much more upside this bull has. In contemplating this question there is no better place to start the analysis than with the market’s heftiest driver – the tech sector.
Size Matters
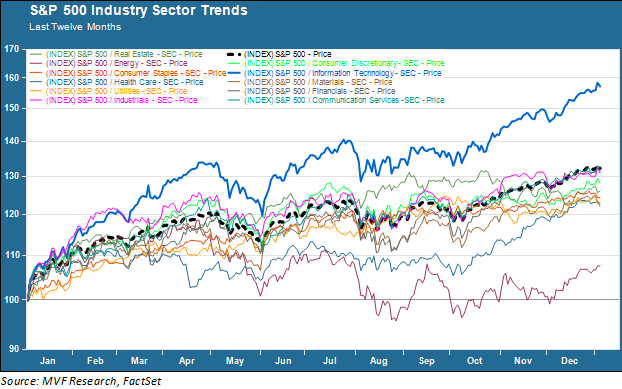
The chart below shows the performance of the S&P 500 and its eleven primary industry sectors for the past twelve months. One sector stands alone – tech (the blue trend line). It also happens to be, by a very wide margin, the largest sector in the index.

The information technology sector currently makes up 25.2 percent of the S&P 500’s total market capitalization. The tech sector plus the communications services sector (home to Google and Facebook, among others) combined make up 36.7 percent of the index’s market cap. Moreover the combined size of five companies – Alphabet (Google), Facebook, Amazon, Apple and Microsoft – comprise 18.9 percent of the total index. By comparison the second largest industry sector – healthcare – makes up just 15 percent. That is a stunning amount of market concentration. It also helps explain some of those skeptical voices as 2020 gets underway. If the tech sector is unable to record a second consecutive year of greater than 50 percent in total return, where is the heavy lifting going to come from?
Watch Those Earnings
This is a tough market environment for bargain-hunters just about anywhere – but the tech sector is, unsurprisingly given those return numbers, particularly stretched. The next twelve months (NTM) price-earnings ratio for the S&P 500 tech sector is 22 times, the highest since the dot-com mania at the beginning of this century and well above its 10-year average of 14.7 times. Meanwhile the earnings outlook for the sector is relatively modest: the FactSet analyst consensus estimate is for mid-single digit earnings growth in the first half of 2020. Any price appreciation beyond five or six percent (if those estimates are correct, and chances are good that they will come down as the days go by) will thus involve a further expansion of those already-rich valuation multiples.
None of this means that the market is doomed to mediocrity, of course. Fundamentals like earnings and sales matter in the long run, but short-term price movements are largely untethered to rationality. But the math of the market is inescapable: its concentration in a relatively small number of names makes the fate of those names decisive for performance. Or, as we often say: when tech sneezes, the market comes down with the flu.