The current bull market in US equities, the pundits tell us, is the second-longest on record. That may sound impressive, given that domestic stock exchange records go back to the late 19th century. But it doesn’t even hold a candle to the accomplishments of the current bull market in bonds. The bond bull started in 1981, when the 10-year US Treasury yield peaked at 15.84 percent on September 30 of that year. It’s still going strong 36 years later, and it’s already one for the record books of the ages.
According to a recent staff working paper by the Bank of England, our bond bull is winning or placing in just about every key measurement category going back to the Genoese and Venetian financial economies of the European Middle Ages. Lowest risk-free benchmark rate ever – gold medal! The 10 year Treasury yield of 1.37 percent on July 5, 2016 is the lowest benchmark reference rate ever recorded (as in ever in the history of money, and people). The intensity of the current bull – measured by the compression from the highest to the lowest yield – is second only to the bond bull of 1441-81 (what, you don’t remember those crazy mid-1400s days in Renaissance Italy??). And if the bull can make it another four years it will grab the silver medal from that ’41 bull in the duration category, second only to the 1605-72 bond bull when Dutch merchant fleets ruled the waves and the bourses.
Tales from the Curve
But does our bull still have the legs, or is the tank running close to empty? That question will be on the minds of every portfolio manager starting the annual ritual of strategic asset allocation for the year ahead. Let’s first of all consider the shape of things, meaning the relative movements of intermediate/long and short term rates.

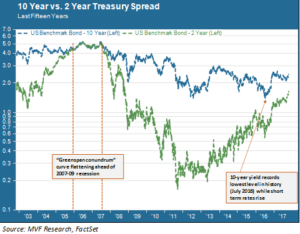
We’ve talked about this dynamic before, but the spread between the two year and ten year yields is as tight as it has been at any time since the “Greenspan conundrum” of the mid-2000s. That was the time period when the Fed raised rates (causing short term yields to trend up), while the 10-year and other intermediate/long rates stayed pat. It was a “conundrum” because the Fed expected their monetary policy actions would push up rates (albeit at varying degrees) across all maturities. As it turned out, though, the flattening/inverting yield curve meant the same thing it had meant in other environments: the onset of recession.
An investor armed with data of flattening yield curves past could reasonably be concerned about the trend today, with the 10-year bond bull intact while short term rates trend ever higher. However, it would be hard to put together any kind of compelling recession scenario for the near future given all the macro data at hand. The first reading of Q3 GDP, released this morning, comfortably exceeded expectations at 3.0 percent quarter-on-quarter (translating to a somewhat above-trend 2.3 percent year-on-year measure). Employment is healthy, consumer confidence remains perky and most measures of output (supply) and spending (demand) have been in the black for some time. Whatever the narrowing yield curve is telling us, the recession alarms are not flashing orange, let alone red.
Where Thou Goest…
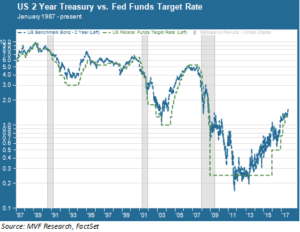
So if not recession, then what? Leave aside for a moment the gentle undulations in the 10-year and focus on the robust rise in the 2-year. There’s no surprise here – the Fed has raised rates four times in the past 22 months, and short term rates have followed suit. Historically, the 2-year yield closely tracks Fed funds, as the chart below shows.

The upper end of the Fed funds target range is currently 1.25 percent, while the 2-year note currently yields 1.63 percent (as of Thursday’s close). What happens going forward depends largely on that one macro variable still tripping up the Fed in its policy deliberations: inflation. We have two more readings of the core PCE (the Fed’s key inflation gauge) before they deliberate at the December FOMC meeting. If the PCE has not moved up much from the current reading of 1.3 percent – even as GDP, employment and other variables continue trending strong – then the odds would be better than not the Fed will stay put. We would expect short term rates, at some point, to settle perhaps a bit down from current levels into renewed “lower for longer” expectations.
But there’s always the chance the Fed will raise rates anyway, simply because it wants to have a more “normalized” Fed funds environment and keep more powder dry for when the next downturn does, inevitably, happen. What then with the 10-year and the fabulous centuries-defying bond bull? There are plenty of factors out there with the potential to impact bond yields other than inflationary expectations. But as long as those expectations are muted – as they currently are – the likelihood of a sudden spike in intermediate rates remains an outlier scenario. It is not our default assumption as we look ahead to next year.
As to what kept the bond bull going for 40 years in the 1400s and for 67 years in the 17th century – well, we were not there, and there is only so much hard data one can tease out of the history books. What would keep it going for at least a little while longer today, though, would likely be a combination of benign growth in output and attendant restraint in wages and consumer prices. Until another obvious growth catalyst comes along to change this scenario, we’ll refrain from writing the obituary on the Great Bond Bull of (19)81.