There’s not much interesting going on in the stock market these days, even less so than in the August “dog days” of years past. Oh sure, the Dow breaks 22,000 and local news stations go into one of their predictable round-number happy dances (as if the Dow Jones Industrial Average were anything other than a quaint relic from the 19th century). The S&P 500 (a more useful proxy for the “stock market”) lazily drifts along, sporadically setting new highs on the gentle currents of decent corporate earnings and low, but fairly stable, macroeconomic growth. Volatility, that once-fearsome stalker of equity portfolios, seems to be on the cup of fossilizing into amber or the permafrost.
Curve Balls
On the other hand, bonds – wow! Everyone’s talking about bonds, normally the portfolio slice over which investors don’t lose sleep. More specifically, everyone’s talking about what could happen to bond prices if central banks follow through on a combination of raising rates and reducing balance sheets. Safe to say that “Raise and Reduce” focuses Wall Street’s attention in the same crystal-clear way that “Repeal and Replace” engaged the gimlet eyes of health care activists in recent weeks. For much of 2017 to date, yields on longer-dated bonds like Treasuries and investment grade corporates have remained relatively subdued while rates at the short end of the yield curve have climbed in expectations of further rate hikes. But ever since Mario Draghi mused about the pace of recovery in the Eurozone in late July, intermediate bonds (in particular Bunds and other European issues) have been channeling much of that volatility that the stock market has lost. Investors reasonably want to know if their bond portfolios are safe.
History Compared to What?
The issue at hand is whether central banks will go ahead with all these “Raise and Reduce” plans. If they were to do so, and if intermediate and long term rates were to suddenly spike as a result, then all those supposedly safe bond portfolios would be in the crosshairs. The “bond bubble” you may have heard about if you tune into the financial news channels and their bespoke pundits contemplates this scenario. At some point, the argument will wind its way back to the phrase “historically low rates” to describe how, after plumbing the lowest levels in the history of the American republic a scant twelve months ago, there is nowhere for rates to go but up, and possibly up a lot.
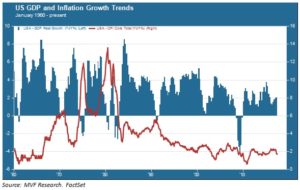
But what exactly are these historical averages, we would ask, and how relevant are they to the current environment? Bond yields don’t exist in a vacuum; they generally are related to the rate of growth and, particularly, the rate of inflation in an economy. In this context, historical averages are misleading. The average rate of core inflation (consumer prices excluding the volatile sectors of energy and food) from 1960 to the present was 3.8 percent, and the corresponding average rate of real GDP growth was 3.0 percent. Over the same time period, average yields on the 10-year Treasury bond were 6.2 percent, clearly far above where they have trended for most of this decade.
Past Performance Indicative of Nothing in Particular
But this 57 year “history” is hardly homogeneous. The first half of the 1960s enjoyed the tailwind of a very unusual confluence of productivity growth and growing labor participation that began after the Second World War. Those trends had petered out by the early 1970s, replaced by lackluster growth and soaring inflation – the “stagflation” era that still gives central bankers nightmares and clouds their policy thinking. Growth resumed in the 1980s with the help of both household and corporate debt, then experienced a very brief spike in productivity in the late 1990s. An uneven pace of growth in the mid-2000s collapsed with the 2007-09 recession, leading us to the current era of slow growth, tepid wages and moderate consumer prices.
The chart below shows the GDP and inflation trends over this time period. If bond yields are supposed to reflect what the collective wisdom considers a reasonable reward for deferring consumption today for return tomorrow, then what does this past history tell us about where rates might reasonably be in the weeks and months ahead?

As we have argued numerous times in these pages, the case for long-term growth much above the current trend of around 2 percent is weak: none of the catalysts – population, labor force participation or productivity – are working in the right direction. What would drive sharply higher inflation, then? And in the absence of a genuine inflation threat, what would prompt central bankers – well aware of their status as practically the only relevant economic policymakers in the world today – to take draconian action to battle imaginary dragons?
One can never rule out the potential for human error, and central bankers of course are still only human. But we do not think that a collapse in bond prices arising out of intensely hawkish central bank maneuvers is a high or even moderate probability scenario as we chart out the final leg of 2017 market trends.