
MV Weekly Market Flash: Calling...

Yep, it’s a bubble. Not a maybe-bubble or a kinda-bubble, but the genuine artifact, we will argue. While the term tends to get bandied about fairly liberally, actual bubbles are relatively rare creatures in the ecosphere of the global capital marketplace. Let’s consider the evidence from several different viewpoints. We start by explaining what we actually mean when we say “bubble” rather than just “roaring bull” or some other terminology.
Fire Burn and Cauldron Bubble
A bubble occurs when the price of an asset becomes unmoored from a reasonable measure of that asset’s fundamental value. Now, assigning value is a mix of art and science and therefore is not as universally, irrefutably true as, for example, saying that “force equals mass times acceleration.” But we can look at an asset’s trend in revenues or earnings and relate that number to the asset’s price in the market. In the chart below we show the forward 12-month price-to-earnings (P/E) ratio for the S&P 500 from the beginning of 2000 to the present. “Forward” earnings represent a consensus forecast among securities analysts who follow companies as to what the earnings per share will be in twelve months’ time.
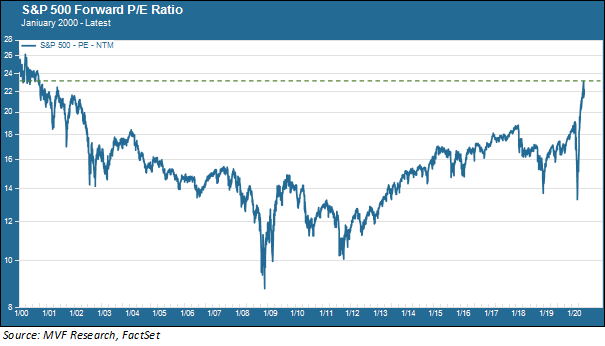
As the chart shows, the forward P/E today is higher than at any time since the summer of 2000, and just below the all-time peak of March 2000 at the height of the tech bubble that gathered steam in the late 1990s. Not at any time since organized stock exchange trading began in the late 19th century had stock prices deviated from underlying earnings values than they did at the height of the tech bubble. Now they are within striking distance of that laurel and will attain it if this current phase of the rally gets another leg up after briefly stalling last week.
Sentiment and the “Traders Bros”
Now let’s consider a slightly different perspective on the same time period. “Sentiment” sounds like a somewhat flaky term conjuring up the idea of emotion not necessarily supported by underlying facts. In a nutshell, yes – and that is precisely how much of the short-term money that sloshes around the market trades. A good way to reflect sentiment in the market is through the volume of put and call options trading at a given time. Options are popular with short-term traders because they are a relatively inexpensive way to take a simple sentiment position. A call option (the right to buy shares sometime in the future at a specified price) signifies optimism about where the market is headed, while a put option (the right to sell shares at a future date at a specified price) indicates the belief that stock prices are due to fall. As day trading platforms have proliferated in recent months, so has the use of put and call options by the so-called “trader bros” – retail punters with vast amounts of self-confidence to match their vast lack of knowledge about investment fundamentals. They’re a big thing on Twitter now, apparently.
Think of the chart below as a fairly straightforward distillation of animal spirits in the market based on the ratio of outstanding put and call positions. A lower ratio means a higher preponderance of calls (hence bullish) while a higher ratio means puts are dominating and sentiment is bearish.
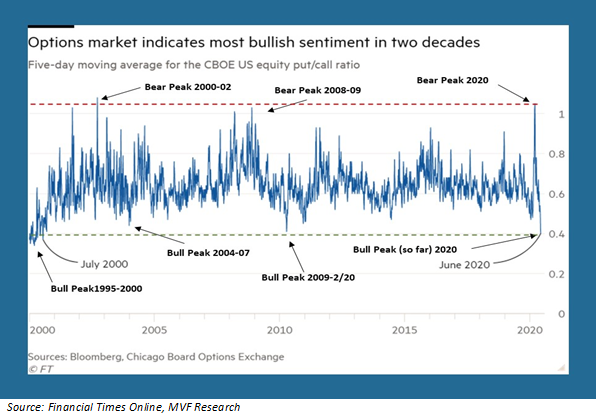
This chart underscores the main point of our commentary last week – the unprecedented speed of the sentiment shift from fear to greed this time around. The bear peak of late March was higher than at any time since the depths of despair after the dot-com crash in 2002, and even higher than at any point during the financial crisis of 2008. But the bullish sentiment driving prices ever higher since then has brought us back to the optimism of July 2000, when sentiment was only slowly starting to back off the giddy heights of March 2000.
But What’s the Narrative?
So there we have it: in the space of ten weeks sentiment ranged from more fearful than it ever was during the 2008 financial crisis to more bullish than it ever was during the previous two bull markets (2004-07 and 2010-20), and almost as giddy as the peak of the dot-com bubble. But here’s where the current bubble starts to look even more bizarre than that one back at the turn of the century: what’s the underlying narrative? Why the high spirits when by most economic measures the global economy is in worse shape than any time since the Great Depression?
Contrast today’s economy with that of the latter years of the tech bubble. Back then the economy was growing at a robust rate. From January 1995 to December 2000 the average year-on-year real GDP growth rate was 4.1 percent. Unemployment was low, inflation was in check and the purchasing power of household incomes was rising at a higher rate than at any time since the early 1970s. Added to this glowing macroeconomic picture was the narrative of the Internet itself: a “new economy” based on massive productivity gains from this digital breakthrough. Yes – the prices ran away from any real sustainable value from the likes of Pets.com and other dot-come darlings. But at least there was a story to tell.
And what’s that story today, with valuation multiples up there in the dot-com stratosphere? Real GDP growth from the beginning of 2010 to the end of 2019 was 2.2 percent. Yes, unemployment was close to record lows, and inflation was nowhere to be seen. But wages were by and large stagnant. Productivity was almost non-existent. Most of the growth that did exist was confined to an incredibly narrow number of giant technology platforms. This was the economy that existed before the pandemic. This is what those who still fantasize about a “V-shaped recovery” hope we will be back to in short order. And that’s probably the best – and not highly likely – possible outcome on the other side of this terrible stretch. All of which makes this bubble even more head-scratching than the last.
Ticking Away
So there is what we think is a quite a compelling argument for a bubble. Now for the caveat: the existence of a bubble does not in any way send a clear signal that the bubble is about to pop. If you were paying attention to markets back in the 1990s you may recall that then-Fed chair Alan Greenspan warned of “irrational exuberance” in 1996. 1996! Heck, the bubble was just getting under way. Two years later there was a scare that drove many asset managers to reposition out of equities: the Russian government defaulted on its debt and the hedge fund Long Term Capital Management nearly took the market down with it as it went bankrupt. But no – the bubble kept on going for two years after that.
Or think about the other famous stock bubble of recent history: the Japanese stock market in the late 1980s. Valuations on the Tokyo Stock Exchange were insane by any rational metric as early as 1986 – but the bubble didn’t pop until the end of 1989. And then, boy did it pop.
So what does a prudent investor do, knowing there is a bubble but not knowing how much longer it will keep expanding? We believe the correct approach is to maintain a more defensive position in risk assets than usual, given the strong evidence of price-value disparities. But this does not mean getting out of the market entirely and foreclosing exposure to what may still be an extended period of appreciation ahead. This requires patience and discipline, which is not always easy but we believe is the right thing to do.