Supply chain dysfunctions cast a pall over the earnings reports of two of the most habitually reliable bearers of good tidings, Amazon and Apple, with both tech behemoths not only failing to beat the Street’s estimates for the third calendar quarter, but warning of headwinds aplenty ahead. US gross domestic product for the third quarter was also underwhelming when the flash estimate came out yesterday – still positive growth, but at the lowest rate since before the pandemic. Meanwhile, inflation remains elevated. The headline personal consumption expenditure (PCE) index released this morning was 4.4 percent, up slightly from last month. Bafflingly, the average yield on junk bonds remains below inflation. As we noted in our commentary a few weeks back, this means that investors are getting no actual purchasing power for the additional credit risk they are taking in these speculative-grade issues.It’s a strange world indeed. No wonder Mark Zuckerberg wants us all to chuck it aside and dive into his Edenic fantasies of the metaverse, whatever that actually ever winds up being.
Curiosities at the Short and Long Ends Alike
Into this confusion wades the Fed, as the Federal Open Market Committee gets ready to meet next week and discuss monetary policy. What is likely to come out of this meeting? The bond market doesn’t seem to know. Strange things are happening at both the short and long ends of the yield curve.

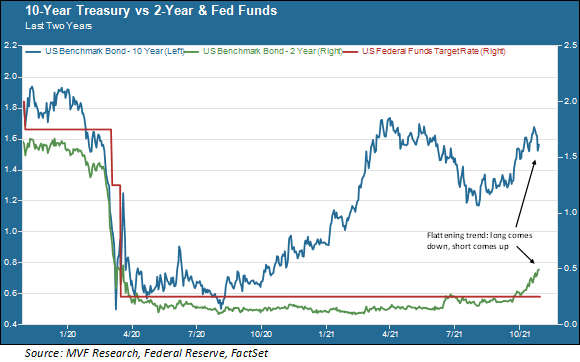
Let’s start with the short end. The Fed funds rate (the crimson line in the chart) has been fixed with an upper bound of 0.25 percent and lower bound of zero since the pandemic began. For most of this time short-term rates (represented in this chart by the 2-year Treasury yield in green) have been clustered within that same 0.0 – 0.25 percent range. Since the Fed has bent over backwards to emphasize that it is not contemplating even thinking about raising rates any time soon, short-term bonds would seem to be the most predictable thing out there. Not so in recent days, much to the chagrin of many fixed income traders who play the spread for a living. As you can see in the above chart, the 2-year has moved steadily up in this time from around a quarter of a percent to half a percent. That may not sound like much, but in growth rate terms that’s the same as a ten dollar stock popping to twenty dollars in a matter of days. For traders with millions at stake in these positions, it’s a big deal.
What seems to be driving these moves at the short end is a growing bet – not a broad consensus yet, but a sizable plurality gaining steam – that higher inflation will force the Fed’s hand sooner rather than later. Bond market watchers point to the UK, where many believe the Bank of England is set to raise rates next week as inflation plagues the British economy. Australia and Canada are also candidates for interest rate action for similar reasons – inflation, supply chain problems and the energy shortage. Many will be watching what the Fed has to say about inflation next week. Jay Powell, high priest of the “it’s just transitory” mantra, will have his work cut out if he wants to continue making this case.
The Growth Question
Inflation doesn’t explain everything on the yield curve, though. What about the long end? With inflation edging up towards mid-single digits, why has the ten-year yield been coming down (and the 30-year yield by an even larger amount)? This is the other side of the puzzle that has gobsmacked yield curve traders. A couple things seem to be going on here. For one, the peak growth narrative is still in place and got an added boost this week when the GDP numbers came in well below expectations.
For another, investors’ assumptions on the volume of future government bond issues have come down as it has become crystal-clear that the Biden administration won’t be spending anything close to $3.5 trillion on new social spending (while it looks like a deal in the neighborhood of $1.7 trillion may make it into law, there are still apparently unresolved roadblocks preventing anything from moving forward). Finally, some of the curve flattening can be explained simply by the technicalities of traders unwinding their positions to limit their losses.
Taper Tedium
In advance of next week’s FOMC meeting the Fed has at least been smart about one thing. It will probably announce a timetable for reducing its monthly bond-buying program, from $120 billion per month at present down to zero probably in the middle of next year. Because of how this news has been telegraphed – and especially because the Fed has made a sharp distinction between its tapering policy and its interest rate policy – the announcement probably will not produce the kind of “taper tantrum” we saw in 2013 when the subject first came up at the Bernanke Fed. Not a gasp of horror so much as a yawn of boredom.
But deciding to taper isn’t really a hard decision; it’s not a particularly useful tool for solving any of today’s big economic challenges. The tricky part is interest rates, and here there does not seem to be any good answer. How Jay Powell threads his presentation through all the confusing strands of activity out there will probably be of much greater interest to observers than when tapering starts.