Second half already? As the third quarter of Year 2019 gets underway, pundits great and small will no doubt be pondering what surprises the remaining months will have in store for us. We kick off the back half of the year with tidings of great perseverance, as our economy now is officially the longest on record. Three cheers, or something. The august mavens at the Business Cycle Dating Committee (yes, really) of the National Bureau of Economic Research, the semi-official proclaimers of growth cycles and recessions, figure that the current upswing began in June 2009, making this the 121st month of the cycle. Take that, economy of the 1990s with your paltry 120 months of good times!
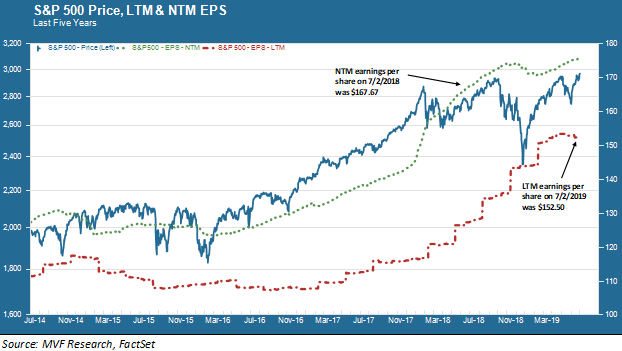
One subject that did not get much attention in the first half of the year was corporate earnings. Arguably, earnings are the most important thing to pay attention to when analyzing stock prices, since (in theory, anyway) a stock price is nothing more and nothing less than a net present value assumption of the future earning potential of a company’s assets in place. But the year’s first two earnings seasons played second fiddle to the much more obsessed-over Fed pivot on monetary policy and the constant ebbs and flows of the trade war. They might start to matter again. In the chart below we show the earnings per share (EPS) trend – a largely positive trend – for the S&P 500 over the past five years.

Okay, so what’s going on with this graph? The dotted green line represents next twelve months’ (NTM) earnings; in other words, what earnings are likely to be twelve months from now according to the analysts who cover these companies for securities firms. For example, we note that on July 2, 2018 the consensus estimate of these analysts was that, one year hence, the actual earnings per share of the S&P 500 would be $167.67.
However, one of the fixtures of life in analyst world is that projections rarely match up with reality. In that same chart above we can see that on July 2 of this year (i.e., yesterday) the actual last twelve months’ (LTM, the dotted red line) S&P 500 earnings amounted to just $152.50. Why the discrepancy? The gap between projected and actual earnings is an accumulation of years and years of misfires by the analysts due to anything from calculation errors to unexpected events to occasional efforts to game the system.
In any event, the combined intelligence from both the forward-looking and backward-looking EPS numbers tells us that earnings have slowed since the end of last year, and also that analysts expect the growth rate in the months ahead to be modest. The consensus analyst growth estimate used by FactSet, a market research company, currently stands at 2.95 percent for the full year 2019. As recently as December of last year, the same analysts were predicting EPS growth of 6.57 percent for the same period.
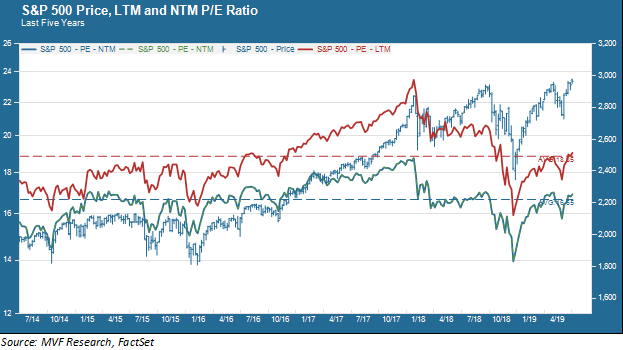
Where that dotted red line of LTM earnings goes from here will no doubt be related to what happens to the economy at large in the near term. The prospect of an economic slowdown has taken root in investors’ minds, and has been the principal factor driving the Fed’s abrupt dovish pivot on monetary policy. The market loves a dovish Fed like little else, but weak earnings can throw a wet blanket on the best laid plans of the FOMC. Earnings, after all, are the denominator of the price-earnings (PE) ratio, arguably the most widely used valuation metric for stock prices. The chart below shows the PE ratio trend (for both NTM and LTM earnings per share) for the past five years.

One might interpret this chart as suggesting that there is not much to worry about valuation-wise. Both the LTM (red) and NTM (green) PE ratios are not too far away from their five year averages of 18.9x and 16.7 times respectively. That is comfortably below where they were for most of 2017 and 2018 up to the major stock market pullback last fall. But they still are not particularly cheap by historical comparison. According to a related measure, the Cyclically Adjusted Price Earnings (CAPE) ratio published by economist (and Nobel Prize winner) Robert Shiller, the market today is still more expensive than it was at the peak of any growth market except for those of 1929 and 2000.
What that means is that there may not be much room for the numerator of the PE ratio – stock prices – to run too hot without a concurrently brisk pace of earnings growth. The PE ratio can expand (i.e. stock price growth outpaces earnings growth) if investors believe the earnings will eventually catch up. This often happens in the early months of a recovery cycle. Alternatively, the ratio may compress (i.e. outsize downward pressure on prices relative to earnings) if expectations are for a winter season for earnings. This is frequently a feature of late-cycle behavior, when sentiment about growth prospects wanes. We may not be there yet – again, there are no compelling signs of an imminent recession – but sentiment has a habit of running ahead of the facts on the ground. We will be paying close attention as companies gear up for the start of this next earnings season after the holiday.