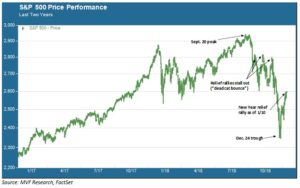
The world of finance has its own particular lexicon, handed down from generation to generation of Wall Street and City folk. “Dead cat bounce” is one of the more colorful, if dolorous, examples of the patois of equity traders. It refers to a relief rally after a sharp pullback that fails to propel itself far enough to reclaim the high ground set by the last bull market peak. In the case of the pullback that began last October, we have already seen three unfortunate kitties bounce lamely off intermittent selling pauses. The chart below illustrates the topography of this pullback (which, as you will recall, stretched to a magnitude of minus 19.8 percent at its Christmas Eve trough).

The Wall of Round Numbers
As we write this commentary on Friday morning the S&P 500 is dithering somewhat around the price level of 2,600. That’s not surprising in that 2,600 is exactly 100 points above 2,500, which is the last place the index wavered for a few days before resuming its upward ascent. As we have said many times, there is nothing magical about these round numbers…except that the trading patterns of the computer models that dominate every day’s volume of trades confer importance on them. Given where general short-term sentiment appears to be – genuine relief that the pullback in December stopped short of a bear market, some soothing words from the Fed, and optics (if not a whole lot more) from US-China talks on easing trade tensions – we would be not at all surprised to see that 2,600 threshold breached in the coming days if not today. To prove that this Schrödinger’s cat is of the live variety, though, there are 200 more points to get back to those intermittent relief rally highs, and another 100 of climbing after that to reach the Hillary Step within sight of that 9/20 Everest peak. That could involve many days and multiple returns to lower base camps before a new bull confirmation can be presumed with confidence.
Back In the Real World…
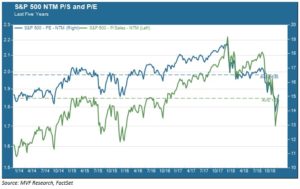
While those whimsical round numbers do matter in the context of short-term market moves, the only determinant of long-term value for any common stock is that company’s financial condition, specifically the magnitude and timing of its future cash flows. Here we may have reason to be somewhat optimistic in the weeks ahead. Earnings season gets underway next week, and attention will focus not only on how well companies performed in the fourth quarter relative to expectations, but also how they guide performance for the twelve months ahead. From a valuation standpoint, there is good news to be had from paying attention to these metrics. The chart below shows both the price-to-sales (P/S) and price-to-earnings (P/E) ratios for the S&P 500 for the last five years. Both ratios are expressed on a next twelve months (NTM) basis, meaning the consensus forecast for the year ahead at each point on the graph.

Thanks to a combination of strong sales and earnings growth in 2018 and the magnitude of the stock market pullback, valuation levels currently look quite attractive relative to the past five years. The price-to-sales ratio (green graph) is right around its five year average. The P/E ratio (blue graph) is well below its five year average of 16.5 times, but that is somewhat misleading. Earnings here are after-tax, so they reflect the massive windfall to corporate bottom lines created by the tax cuts of December 2017. That windfall will fade now that one year has passed since the tax cuts were enacted, and earnings growth will moderate accordingly. Whatever way you look at it, however, current stock price valuations are not excessively dear. The current outlook for Q1 2019 sales growth is around 5.6 percent according to market research firm FactSet, and earnings are projected to register a bit more than 10 percent growth. If that kind of cadence can be sustained through Q2 and beyond, it should provide at least something of a tailwind to stocks.
The Unknowns Abide
Of course there is no certainty that sales and earnings will continue their robust growth clip, as that will depend in turn on evolving global demand trends, ten years into an economic growth cycle. As we noted last week, IMF forecasts for growth in 2019 have moderated, with potential trouble spots including China and the EU. Regardless of whatever happy talk comes out of the current round of trade talks there are plenty of unresolved issues there. And plenty of other X-factors lurk in the soup of any given day’s data feed. We continue to believe that market trends this year will be challenged by higher than usual levels of volatility. All that being said, though, continued strength in corporate sales and earnings will matter a great deal, starting with the first batch of releases next week.