From the beginning of January to the beginning of March, the S&P 500 set a total of 13 new record highs. Twelve of them happened after January 20, which no doubt made for an unhappy crowd of “sell the Inauguration” traders. Since March 1, though, it’s been all crickets. The benchmark index is a bit more than two percent down from that March 1 high, with the erstwhile down and out defensive sectors of consumer staples and utilities outperforming yesterday’s financial, industrial and materials darlings.
More interesting than the raw price numbers, though, is the risk-adjusted trend of late. To us, the remarkable thing about the reflation trade – other than investors’ boundless faith in the pony-out-back siren song of “soft” data – was the total absence of volatility that accompanied it. The reflation trade reflected a complacency that struck us as somewhat out of alignment with what was actually going on in the world. In the past several days, though, the CBOE VIX index – the market’s so-called “fear gauge” – has ticked above 15 for the first time since last November’s election. Half a (pre-holiday) week doth not a trend make – and the VIX is still nowhere near the threshold of 20 that signifies an elevated risk environment – but there may be reason to suspect that the complacency trade has run its course.
Risk-Adjusted Bubble
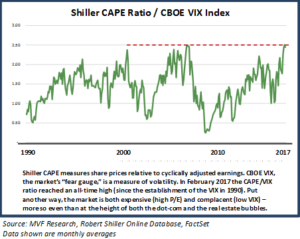
Equity markets have been expensive for some time, with traditional valuation metrics like price-earnings (P/E) and price-sales (P/S) higher than they have been since the early years of the last decade. But they remain below the nosebleed levels of the dot-com bubble of the late 1990s…unless you add in a risk adjustment factor. Consider the chart below, showing Robert Shiller’s cyclically adjusted P/E ratio (CAPE) divided by the VIX. The data run from January 1990 (when the VIX was incepted) to the end of March 2017.

When adjusted for risk this way, the market recently has been more expensive than it was at the peak of both earlier bubbles – the dot-com fiesta and then the real estate-fueled frenzy of 2006-07. The late 1990s may have been devil-may-care as far as unrealistic P/E ratios go, but there was an appropriate underpinning of volatility; the average VIX level for 1998 was a whopping 25.6, and for 1999 it was 24.4. Quite a difference from the fear gauge’s tepid 12.6 average between November 2016 and March of this year.
Killing Me Softly
In our era of “alternative facts” it is perhaps unsurprising that the term “soft data” took firm root in the lexicon of financial markets over the past months. The normal go-to data points we analyze from month to month – real GDP growth, inflation, employment, corporate earnings and the like – have not given us any reason to believe some paradigm shift is underway. Meanwhile the soft platitudes of massive infrastructure build-out and historical changes to the tax code have ceded way to the hard realities of crafting legislature in the highly divisive political environment of Washington. Survey-based indicators like consumer or business owner sentiment, which have been behind some of the market’s recent era of good feelings, are not entirely useless, but they don’t always translate into hard numbers like retail sales or business investment.
The good news is that the hard data continue to tell a reasonably upbeat story: moderate growth in output here and abroad, a relatively tight labor market and inflation very close to that Goldilocks zone of two percent. This should continue to put limits on downside risk and make any sudden pullback a healthy buying opportunity. But we believe that further overall upside will be limited by today’s valuation realities, with an attendant likelihood that investors will return their attention to quality stocks and away from effervescent themes. And, yes, with a bit more sobriety and a bit less complacency.