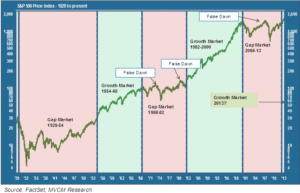
We have been in a growth market environment since March this year, when the S&P 500 recaptured and surpassed its previous record high of 1565. Is this going to become the next macro growth market – only the third since 1954 – or will history record it as yet another false dawn? This is the key question weighing on our minds as we begin the preparation of our 2014 strategy models.
Growth and Gaps: A Refresher
A macro growth market is one in which broad market indexes, like the S&P 500, surpass a previous record high never to return. Conversely, when the market turns down and fails to reach its previous high, we are in a gap market environment. We call it a “gap market” because, in the context of a long term price index chart, these periods look like gaps in an otherwise upward-sloping trend. The chart below shows a history of growth and gap markets from 1929 to the present:

False Dawns
We see that, in each of the past two gap market environments, there were false dawns. This is when the market manages to recover its losses and set a new record high, only to fall back down and extend the gap market. It happened twice in the ’68-82 environment, in 1973 and in 1981. More recently, the S&P 500 regained all the ground it lost after the 2000 tech bubble collapse, reaching new highs in October 2007. That was the falsest of false dawns. Equities turned down in late ’07 and slid into the cataclysm that was 2008. At its worst, the 2008-09 drawdown took the S&P 500 back to levels last seen in 1996.
In the Mix: Easing and Earnings
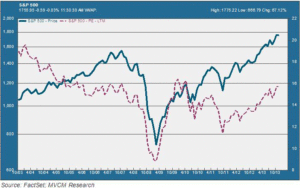
Thanks largely to the Fed and the European Central Bank, markets have managed to fend off a handful of curve balls thrown their way on the road to regaining lost ground. Experts may debate the effectiveness of quantitative easing on the real economy of jobs and production, but there is little doubt that it has propped up the values of financial assets. At the same time, corporate earnings have also reached record levels. The robust pace of earnings growth has kept markets from entering bubble territory. We can see this in the following chart, which shows the ten year performance of the S&P 500 price index and its TTM (twelve trailing months) price-to-earnings (P/E) ratio:

While asset prices have advanced steadily over the past several years, strong earnings gains (the denominator of the P/E equation) have kept valuation levels in check. The key question is this: in a world of sluggish GDP growth, can companies continue delivering the results? A key determinant of recent growth has been an increased global footprint by S&P 500. Global growth has slowed, though, including many of the key growth engine markets. Brazil’s real GDP growth in 2012 was under 1%, putting it in the company of the anemic Eurozone economies. With a slowdown in top-line growth, companies will have to continue making the efficiency gains in their cost structures that have been the other key growth factor.
When we make investment decisions we do so around the likelihood of alternative outcomes. We continue to be of the view that the likeliest outcome for 2014 will be a continuation of the growth market trend, albeit with some potential pullbacks along the way. But we remain mindful of the potential for false dawns and the need to be vigilant sentinels of the portfolios under our management.