We’re halfway through September and markets have gone a bit wobbly, as some random character in a Bridget Jones sequel might say. Nothing yet to require the smelling salts, but the VIX volatility index has perked up into the high teens while the S&P 500 is back to flirting with that May 2015 ceiling of 2130 it had finally broken through back in July. If you were a reader of our weekly commentary back in the first half of this year, you would recall our frequent use of the phrase “valuation ceiling” in this context. This was how we described the stiff resistance headwinds US large cap stocks faced in managing a sustained price rally given the lackluster pace of earnings growth.
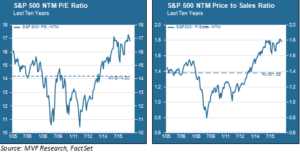
Fast forward to the present. While 2130 is now more of a loose support level than a hard price ceiling, not much has changed on the sales or earnings front. Indeed, share valuations remain very close to decade-long highs. The chart below shows the ten year price to earnings and price to sales ratios (based on next twelve months estimates). We consider why these valuation levels might – and might not – matter to near-term price performance.

The Expectations Game
According to FactSet consensus projections, average Q3 earnings for S&P 500 companies are estimated to come in at -2.2 percent, which is quite a bit lower than the 0.3 percent increase projected by the same consensus group back in June. At face value that is not good news for already expensive stock prices. There are a couple caveats, however.
First, earnings season is essentially an elaborate Kabuki dance between the sell-side securities firm analysts who make up that “consensus” and the corporate management teams who talk the analysts through their financial results each quarter. The formula is every bit as stylized and predictable as the 1,000th retelling of the Tale of Genji on an actual Kabuki stage. Companies “guide light” on sales and earnings over the course of the previous quarter, and analysts steadily lower their projections in response. Then, lo and behold, the results come in and the companies manage to jump over that lowered expectations bar. These “upside surprises,” in Wall Street earnings-speak, usually account for more than 70 percent of the total variance between expected and actual earnings per share results.
Averages and Outliers
So the fact that earnings are projected to drop another 2.2 percent doesn’t mean much as the Q3 season gets under way. We fully expect that figure to trend up and potentially turn positive as more results come in (thus far only one company has reported). More importantly, though, is that the average skews negative almost entirely due to the residual heavy losses being experienced by the energy sector. Earnings in this sector are projected to decline by 68 percent, for reasons already widely known and largely priced in. Energy stocks may look wildly expensive, given how far the denominator of the P/E equation has plunged over the last twelve months, but investors by now have largely discounted the misery of last year’s oil price drop and assume more stability ahead, if not necessarily robust growth.
Energy stocks at this point make up about 6.5 percent of the S&P 500’s total market capitalization. By contrast, the four leading sectors by this metric – technology, health care, financials and consumer discretionary – account for more than 65 percent of the index’s total market cap. Q3 earnings growth for these for sectors is expected to be in the low-mid single digits. The Q4 outlook (for what it’s worth, given that Q4 earnings Kabuki hasn’t even started yet) has these four leading sectors growing a bit more than eight percent.
Valuation Matters, But Not for Timing
Does any of this matter? Yes, valuation does matter, because in the long run a company’s stock price is no more and no less than a function of the company’s future ability to generate cash flows with its assets in place. In the short run, though, the valuation ceiling may be as hard as a rock or as porous as a sponge. Today’s NTM P/E of 16.8 times is expensive, but nowhere near the nosebleed mid-20s levels it reached at the height of the technology bubble in early 2000. In fact, as we have noted in previous commentaries, the late stages of a bull market often come with a giddy disregard for valuations as late money and animal spirits chase performance with a “greater fool” mentality. That has not yet happened in this bull run. After the twists and turns of September and October, though, we’ll see whether Santa Claus is ready to come out and play.