The trading week is not yet over as we write this piece on Friday morning, but it looks as if the S&P 500 will end the week down for the fourth week in a row, marking the first time that has happened in over a year. Of course, this comes on the heels of a relentless five-month rally that took valuations to levels not seen since the peak of the dot-com mania twenty years ago, so the pullback does not exactly come as a surprise. Much of the commentary in the financial media this week has focused on the concerns potentially feeding into negative statement, including a stalled economic recovery with no further fiscal relief in sight, the resurgence of Covid-19 cases in Europe (and a continuation of the high daily numbers here at home), growing concerns about the integrity of the upcoming election…the list goes on.
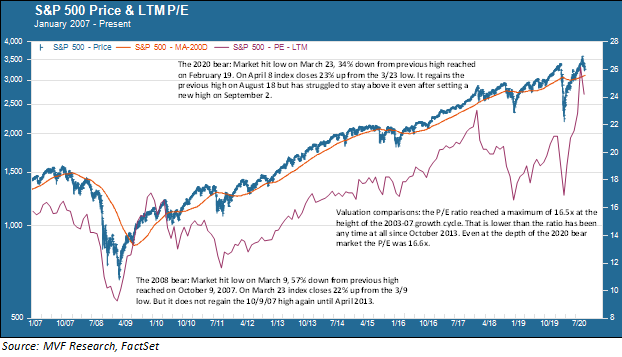
Some of the chatter, though, has been around the fact that the S&P 500 is once again below the pre-pandemic high of 3386 reached on February 19 (it closed yesterday at 3246, about 4 percent below the 2/19 high). That is leading some pundits to question whether we were too hasty in pronouncing the end of the bear market. This question won’t necessarily be answered for a while, but it’s worth taking another look at how different this current cycle has been from the one that preceded it. The chart below shows the market’s price trend (along with its P/E ratio for valuation comparisons) since the beginning of 2007.

Definition, Please
Let’s start with what we do know for sure: the eleven year bull market reached its high point on February 19 and then fell into a bear market – down by 20 percent or more – that reached its low point on March 23, down 34 percent from that 2/19 high. That eleven-year run was the longest bull in history, though it came close to ending on a couple occasions in 2011 and 2018.
That’s where the common agreement ends. As we all know, the market rebounded sharply from that 3/23 low point. By April 8, just two weeks after the low point, it was up more than 20 percent from that low. Was that point the official “end” of the bear? Some say yes, noting that this sharp rebound is in fact quite similar to what happened after the market’s rebound off the low back in March 2009. In that instance it also took not much more than two weeks for the market to climb more than 20 percent off the low, as we describe in the above chart.
Others, though, will say that the bear is only well and truly over when it is able to surpass – and stay above – the previous high point. In the last bear market cycle that took more than five years: the S&P 500 did not permanently rise above its October 2007 high point until April 2013. Even that is not long by historical standards: in the long, stagnant market environment of the 1970s it was not until August 1982 that the S&P 500 permanently rose above the level reached in November 1968.
That’s why you heard the word “unprecedented” so often back in August, when the S&P 500 blew through its February 19 high. Shortest bear market on record, by a mile! Until it wasn’t, at least according to those who insist on that “permanently surpass” formula.
Valuation Headwinds
Anything is possible, of course. Given the high amount of volatility in today’s environment, on which much of our recent commentary has focused, it would not be particularly surprising to see sudden sharp movements in either direction. One aspect that does give us some longer-term concern, though, is the potential headwind caused by valuation levels. In the chart above we have shown the trailing twelve months’ P/E ratio for the period from 2007 to the present. What is noteworthy here is that the P/E ratio at the height of the bull cycle in 2007 was 16.5 times. That peak, in turn, is actually lower than the ratio has ever been at any time since October 2013. In fact, the P/E ratio at the absolute low point of the 2020 bear market was 16.6 times – in other words, still higher at the worst moment of this cycle than it was at the best moment of the 2003-07 bull run.
That may or may not matter for the near term. Short term market movements are perfectly capable of defying any kind of fundamental valuation logic – as the market’s breathless climb in July and August made perfectly clear. But in the long run, valuation does matter. The problem with the “long run” is that it is very possible for it to consist of mediocre growth both for the economy at large and for corporate earnings. There is potentially more optimism baked into current valuation levels than will turn out to be warranted. Of course, we could be wrong and would be perfectly pleased to have future events show us as mistaken. But that is not a chance we can take with the assets we have been entrusted to manage. We expect to have many challenges awaiting us on the other side of this pandemic.