On Tuesday this week the S&P 500 closed above 2000 for the first time ever. When we say “above”, we mean “right on top of”: the actual closing price was 2000.02. On Wednesday the index inched slightly upwards to a close of 2000.12. Of course, there is nothing inherently special or magic about a round number like 2000 versus any other kind of number. But perception creates its own reality. Along with moving price averages, signpost numbers like 1900 and 2000 often act as important support and resistance levels for short-intermediate term asset price trends. We call these “event numbers”.
The Event Number Corridor
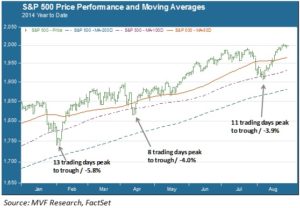
The following chart provides a snapshot of pullbacks in the S&P 500 in the current year to date. They have been fairly short, shallow and infrequent (only three with a magnitude of 3% or more). Interestingly, all three have occurred around an event number: 1850, 1900 and 2000 (there was a pullback of a smaller magnitude at 1950).

What seems to happen here is that the event numbers act as a sort of catalyst for investors to trade on whatever risk factors may be prevailing at the time. Consider the three 2014 pullbacks shown above. At the beginning of this year the S&P 500 had just come off one of its best years ever, leading to general chatter about whether the market was overbought. The market was trading in a corridor just below 1850. The release of a surprisingly negative jobs report early in the year gave traders the excuse to pull money off the table. A -5.8% pullback ensued taking the index to 1750, where it found support and sharply rebounded.
In April the market stalled for a few days just below 1900, then growing concerns about the situation in Russia and Ukraine helped fence-sitting investors to hop off. Again the fear period was brief, and this time support was found at the 100 day moving average level. In July, the risk factors swirling around in the market were for the most part the same as in April: Ukraine, Middle East, Eurozone…and an event number corridor just below 2000 broke in the last week of the month. That too found support around the 100 day average and rebounded sharply…right back up to 2000, where another corridor is playing out.
What Next?
The current event number corridor is particularly interesting because we are heading into to the final months of the year, a time when a strong positive or negative trend formation can propel the market right through to the end of the year. Which way do the tea leaves point?
The short term, of course, is unknowable with any kind of surety: every rally and every pullback is different. Given how long it has been since the market last experienced a real correction, in 2011, each new pullback heightens fears of a slide from mere pullback to secular reversal. But we are still seeing daily volatility levels more typical of a middle-stage than a late stage bull market.
In both of the last two secular bulls, from 1994-2000 and 2003-07, volatility started to head higher some time before the market reached its respective high water marks. Late-stage bulls tend to be frenetic, with hold-outs piling in to belatedly grab some of the upside. It is only after those net inflows subside that the reversal tends to gather steam. Even in the immediate wake of the late-July pullback, though, we still appear to be in one of the calmer risk valleys, with the CBOE VIX index not far away from its ten year low.
Still, anything can happen. Summer is over. We expect trading volumes to pick up and, sooner or later, a late-year trend to emerge and test more event number support and resistance levels. We head into the new school year vigilant and focused.