
MV Weekly Market Flash: Mayhem...

It has been described – by patients who have contracted the Covid-19 disease and subsequently recovered – as having a high fever, some achy symptoms similar to those associated with a nasty common cold, maybe a recurrence of the fever at a lower temperature and then leaving the system. Of course, a small percentage of those affected do not recover; the mortality rate is currently estimated to be around 3.4 percent. That, then, is the basis for what is truly one of the most volatile weeks financial markets have ever witnessed. The unprecedented nature of this volatility is perhaps most dramatic in the bond market, where the US 10-year Treasury has plummeted to well below one percent, a historic low by miles and miles. In the chart below we offer a composite picture of this mayhem. We’ll look at each of these pieces of the puzzle in turn.
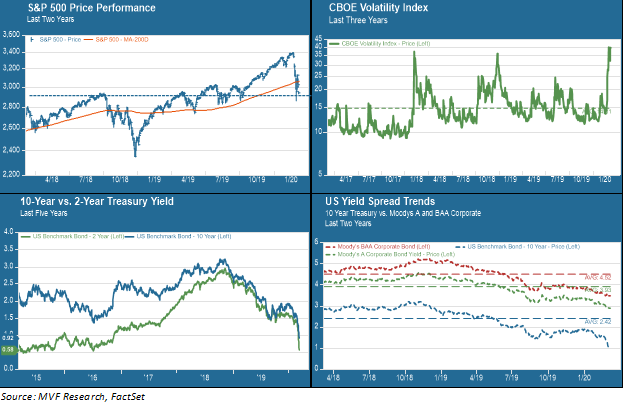
Equities: Right Back Where We Started From
As you can see from the blue dotted horizontal line in the upper-left segment of the chart above, the S&P 500 is currently trading roughly where it was at the peak of the 2018 rally, which is also where it was in that period between the summer funk of 2019 and the subsequent rally that extended throughout last fall and into the first 50 days or so of this year. Mind you, when we say “currently trading” that statement is only as valid as the particular moment when we are typing these lines. The index has moved by more than two percent either up or down each trading day this week on the heels of an equally volatile week last week. By the time we finish this article, let alone by the time it goes through compliance review and is published, “currently trading” could easily mean anything as much as 2-3 percent away from what it means right now.
While there is still some hint of rationality in the price moves – the obvious segments of travel & leisure, airlines and the like are getting hit worse than the broader market – these massive daily price swings are the work of thousands and thousands of trading algorithms all moving in one direction depending on where the tradewinds of the day happen to be blowing. The winds of Monday pointed to a coordinated G-7 teleconference with the potential for coordinated central bank intervention, and that drove markets higher. That didn’t pan out on Tuesday morning, but then a Fed “emergency” intervention of a 0.5 percent cut in the Fed funds rate seemed to confuse more than enlighten, and stocks promptly fell. Tuesday night brought a colossal surprise in the form of a sweeping Super Tuesday victory by Democratic candidate Joe Biden, the extent of which seemed to fuel a confidence rally in risk assets on Wednesday. By Thursday the rapid spread of Covid-19, particularly in Italy but also in the US (with attendant concerns about the readiness of our flawed healthcare system to handle a possible pandemic) sent things south again.
Volatility: Consistent With Previous Peaks
The upper-right segment of the above chart shows the VIX index, the market’s so-called fear gauge which reflects how the price of put options can suddenly spike upwards when market sentiment turns for the worse. As you can see, the current spike in the VIX is fairly consistent with the previous two risk peaks of the past three years: the initial concern about a global trade war in early 2018 when the administration issued the first round of tariffs, and then the near-bear market in late 2018 when markets feared the continuation of the Fed’s then-rate tightening policy in the face of rising economic fears.
Now, those earlier VIX peaks retreated fairly rapidly and risk asset markets settled down. The math of the market suggests that selling bouts only have a limited life span before the extreme panic subsides. The more interesting question is where the volatility trades after the panic. As you can see from the earlier examples, VIX trading settled into a higher average level than the long spell of preternatural calm that defined markets in 2017. We call these higher risk levels “mesas” to distinguish them from the brief Alpine panic peaks and the 2017-like valleys of calm. Given what we see today about the potential economic impact of Covid-19 on both the supply and demand side of the economy (and however irrational this impact may seem, it is clearly manifesting in data points such as the cancellation of expensive public events and outrageous prices for personal-hygiene consumer goods), a post-panic risk mesa at elevated levels even from those of 2018 and 2019 is entirely plausible.
Safe Haven Bonds: Flight to Zero
For all the eye-popping volatility on the equity side of things, the real history this week has been made in the bond market. The lower-left segment of the above chart shows the five-year trading pattern for the 2-year (green) and the 10-year (blue) Treasury notes. Each of these two securities is noteworthy for its own particular reason. The 10-year note’s previous all-time low was set in 2016, at 1.36 percent. That was the lowest the benchmark bond yield had ever reached in the entire history of the American republic. Until, that is, this week when it crashed through that previous low to below one percent. As of early Friday morning trading the 10-year yield is hovering right around 0.7 percent, i.e. at a level nearly half of that former all-time low of 1.36 percent. There appears to be an unprecedented desire for the safest of safe haven assets. Much of this may well be a massive reversal from those very investors – the insurance companies, pension funds and the like – which the Fed had succeeded in pushing out of low-risk assets in conducting its monetary policy reversal last year.
The 2-year note, by contrast, is not at all-time lows but rather roughly where it was at the end of 2014. That is important for another reason, though, because it suggests that markets expect the Fed funds rate, in due course, to be back where it was at the end of 2014 – i.e. at zero. We likely have not seen the last of the Fed in this phase of the cycle, despite the magnitude of this week’s emergency rate cut. The 2-year note, which tracks Fed policy more closely than longer-dated issues like the 10-year, suggests that investors are expecting further rate cuts when the Fed meets in mid-March.
Credit Spreads: Starting to Turn
The fourth segment of the above chart, in the lower-right corner, suggests that even as the absolute level of interest rates continues to head in the direction of zero, the risk spreads are starting to widen between benchmark government securities and other fixed income assets like corporate bonds. You can see in the rightmost part of the chart that the benchmark 10-year Treasury (in blue) has turned down more sharply than either A-rated corporates (green) or Baa corporates (crimson) which are the lowest-rated investment grade bonds. The reason this matters is that corporate debt levels are at historically high levels relative to shareholders’ equity, and a spike in relative yields will put pressure on debt servicing levels and thus on profit margins. Pressure on margins will in turn make an already-stretched corporate earnings picture look even shakier, and could also have the effect of reducing the share buyback activity so beloved of investors. The effect on below-investment grade (i.e. high yield) debt issuers could be even more pronounced and imply an upturn in default rates.
The Composite Picture
The overall takeaway from this set of data points is that we are likely to be in a new phase of this market, with the economic effects of Covid-19 potentially poised to play out over a longer time frame than just one quarter. There is still too much uncertainty about the disease itself to provide any kind of statistically viable guidance as to how broad or deep it will extend, or the extent to which it raises the probability of a recession in the US (the likelihood of one in Europe is measurably higher). As we said in our commentary last week, our portfolios are diversified with risk assets weighted towards the lower end of our approved range. We continue to believe that is the right policy to follow but will closely monitor the unfolding situation to see where we might take advantage of any risk mitigation opportunities around the edges. It is important, we believe, to resist the urge to panic and to let rational analysis guide the decisions we make – in the markets and in our general lives. As always, we are available at any time to discuss any observations, concerns or questions you might have.