Over the past several weeks we have considered various scenarios for capital market performance in 2015 among various asset classes. For U.S. equities we have converged on a base case that sees continued upside in price performance, but with that upside more or less limited by earnings growth. In other words, if earnings were to grow in the upper single digit range as is the current consensus, we would expect to see similar growth for stock prices. While we believe this case to be reasonable, there are other ways 2015 could unfold. We consider one of those alternatives in this article: a late-stage bull rally, or “melt-up”.
The Case for Earnings
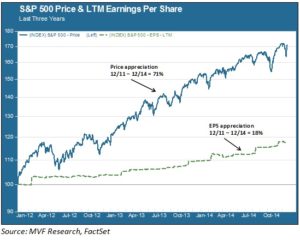
The reasoning behind our thinking for the earnings-led rally is nicely encapsulated in the chart below. This shows that over the past three years stocks have grown at a much faster clip than earnings: the S&P 500 has appreciated by 71% over this time while earnings per share (EPS) for S&P 500 constituent companies have grown at a more modest rate of 18%.

With these numbers in mind, let us consider why our base case posits earnings growth as the likely key driver of stock price performance in 2015. In essence, a company’s stock price is nothing more than a reflection of the potential future value of all its cash flows. It’s not terribly difficult to value these potential future cash flows using time-tested techniques like discounted cash flow models. In theory, the net present value of all these future cash flows, expressed on a per-share basis, should exactly equal the company’s stock price.
The real world is messier than theory, though, so we use metrics like the price to earnings (P/E) ratio as a shorthand way to gauge value. The P/E tells us how much investors are willing to pay for each dollar of net income the company earns. As the above chart illustrates, over the past three years investors have been willing to pay ever more for that same dollar of earnings – that is why stock prices have risen more than three times as fast as the underlying earnings. The P/E ratio for the S&P 500 is higher than it has been at any time since 2004. Margins – income as a percentage of sales – are at historic highs. But those sales have grown at fairly modest rates relative to historical norms. If the top line – sales – is growing at only 2-3%, which is typical for many large cap U.S. stocks, then profit margins must continually improve (e.g. through cost-cutting and business process efficiencies) to support bottom line growth in the 6 – 10% range that has been characteristic of the past several years. We think EPS growth in excess of 5% is reasonable to expect, but see a less compelling case for double digit upside.
So: an expensive P/E multiple, and single digit EPS growth in the context of a benevolent macroeconomic environment argues for stock price growth more or less in line with those mid-upper single digit earnings. It seems reasonable. But there are other variables at play that could produce a different outcome. Enter animal spirits.
The Case for Animal Spirits
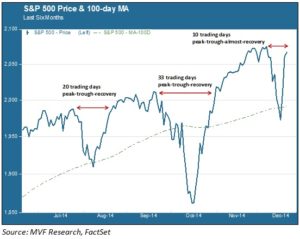
John Maynard Keynes coined the phrase “animal spirits” to reflect the less rational, more emotional side of investing and economic decision making – specifically, the emotions of fear and greed that habitually drive market price trends. It is safe to say that the animal spirit presiding over the second half of 2014 has been the bull. The chart below shows the S&P 500 price performance for this period, and a couple things here are instructive.

First, we have seen the market appreciate by about 6% over this period. But, impressively, this appreciation has come with three fairly significant pullbacks in July, October and December. Each pullback turned out to be incredibly short-lived, with the V-shaped recovery ever steeper. In the most recent December event the pullback was over almost before anyone could actually register that it was happening.
This kind of daily trading pattern indicates a growing level of volatility that was missing for most of 2013 and the first half of this year. Such volatility is sometimes the precursor to a late stage bull market – “melt-up” is the favored industry jargon. Melt-ups happen when money that has been sitting on the sidelines – cash, fixed income portfolios, hedge funds with neutral or short equity positions – comes flooding into high-performing stock markets. This happened in the late stages of the 1990s growth market, when everyone and her grandmother wanted a piece of the dot-com action.
A 2015 melt-up would imply the P/E multiple expansion that our base case discounts. It would probably benefit some of the traditionally riskier asset classes like small caps and emerging markets, as well as beaten-down commodities like oil, natural gas and industrial metals. It would probably require some macroeconomic and geopolitical tailwinds: improvement, or at least no significant worsening, of troubled economies in Europe and Japan, a resumption of trend growth in China, relatively little material fallout from Russia’s ongoing weakness, and a continuation of the positive U.S. economic narrative. And the specter of rising rates could be a catalyst to pull in money parked in fixed income asset classes.
To be clear, our default case remains earnings-led growth with little or no multiple expansion. But market conditions suggest that a melt-up is entirely possible. We remain on the lookout for any attendant tactical opportunities that may present themselves.