There have been three discernible phases of the bull market that roared back from the depths of the coronavirus panic back in March. The first phase was, more than anything else, a reaction to the dramatic efforts of the Federal Reserve to stabilize credit markets through the implementation of novel liquidity facilities shoring. That phase petered out in late April, and the phrases “bear market rally” and “dead cat bounce” started getting airtime. But a second phase took flight from mid-May to early June. That one fell flat as Covid cases started to rise again, once again leading to premature obituaries for the bull market. “Covid, schmovid” said Mr. Market as the Fourth of July holiday came and went, and off to the races they went yet again. Stocks roared through the sweltering days of August led, as seems to always be the case now, by the mega-cap tech darlings.
Calls, Puts and the VIX
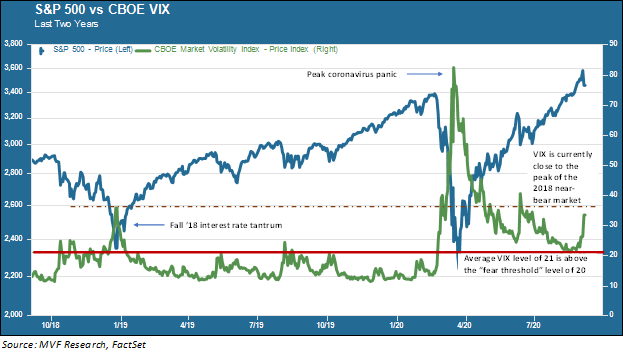
But investors with an eye for these things noticed something unusual about this third phase of the rally. Volatility, which tends to be lower during periods of protracted stock price growth, has been conspicuously higher than is normally the case. The chart below shows one widely used measure of market volatility: the CBOE VIX index (shown here with the S&P 500).

The VIX is often called the market’s “fear gauge” because what it measures is how volatile investors expect stock prices to be in the next 30 days. The index measures this “volatility sentiment” based on the prices of put and call options. These options are essentially bets that prices will rise or fall by a certain amount; options holders profit when market prices move in such a way that the strike price – the price at which the holder can exercise her call or put – is profitable.
For example, an investor might be wild about the car company Tesla (as indeed many have been in recent weeks). The investor thinks Tesla shares are going to continue to continue to soar from their current level (around $385 currently), so he buys a call option giving him the right to purchase shares at $395. That call is not profitable today, but it would be if the share price went above $395.
How does that example have anything to do with the VIX and market volatility? It has to do with where strike prices are – for both puts and calls – relative to current market prices. For example, if call options with strike prices 10 percent higher than current market prices become more popular – measured by an increase in the price of these call options – that implies that investors expect to see market movements of that magnitude.
The same applies to puts, in the other direction (if I buy a put with a strike price 10 percent lower than the current market price it implies an expectation that prices will fall by that amount). Remember that when we talk about volatility in the market – risk, in other words – it goes in both directions. The greater the possible magnitude of deviation from current prices, whether up or down, the greater the risk.
Tradewinds and Tsunamis
In the chart above you can see that the VIX has remained higher throughout this five-month market rally than it was in the last cycle of the previous bull market from early 2019 to February of this year. In fact, the VIX for most of this time has been around the same level as it was during the previous major pullback of fall 2018, when fears over rising interest rates sent the S&P 500 to within a fraction of the 20 percent decline that would have constituted a bear market. And a big part of this higher VIX level has been an unusually high amount of option trading, particularly during that third phase of the rally in July and August.
This brings us to the next piece of the puzzle: why the sudden pullback that started yesterday and has continued into today? Nothing particularly noteworthy happened yesterday to suggest that shares in the tech-heavy Nasdaq Composite should be five percent less than they were the day before. The answer lies in the effect that increased volatility can have on the algorithmic trading programs that dominate trading volume on most days.
Think of these trading programs as waves on the ocean. On most days, the waves move in different directions as gentle tradewinds carry them hither and yon, running into each other and canceling each other out. But on some days a strong wind will blow in one direction, with the waves gathering into the force of a tsunami. Volatility is one such “strong wind” that on any given day can trigger concentrated selling, drowning out the effect of any fundamental factors (like, for instance, today’s generally benign jobs report).
The good news about this kind of a pullback is that the reasons are largely technical and have little to do with any real change in the economic outlook or corporate earnings prospects. At the same time, it is a reminder to us that we are heading into what is often a tricky time of year. Between the coronavirus, a still-fragile economy and lots of uncertainty about the forthcoming election, there are plenty of reasons to stay alert, disciplined and careful. This is definitely not a time to be asleep at the wheel.