
MV Weekly Market Flash: Pullbacks...

Believe it or not, we’re only a couple weeks away from the end of the first quarter. And what a quarter it has been, the lowlight of course being the unthinkable devastation and human misery resulting from an unprovoked war of aggression by Russia on Ukraine. In addition to what is arguably the single most significant geopolitical development since the fall of the Soviet Union, though, this quarter has also witnessed the highest levels of inflation in the world economy in more than forty years. Not to mention the persistence of the Covid-19 pandemic past the Year 2 milestone. That’s a lot for people – and markets – to process. And those are just the threats that are active, clear and present.
The Damage to Date
Given all that’s happened, it is perhaps somewhat reassuring that as of today the damage to broad-based US stock indexes can still be measured in single digits: the S&P 500 is down around 7.5 percent for the year to date as we write this, and the Dow is off by around five percent. The Nasdaq, home to the tech stocks that with their heightened sensitivity to rising interest rates have borne a greater share of the reversal, has meanwhile managed to claw its way out of bear market territory in recent days and sits around 12.5 percent off its level at the beginning of the year (markets are slightly higher in early trading on this Friday, but of course that could change between now and the end of the day).
How does this environment look compared to other pullbacks in recent and not-so-recent times? Every situation has its own unique factors, of course, but we always find it useful to put current events into a larger context. With that in mind let’s consider all the times the S&P 500 reversed by ten percent or more, going all the way back to the tech sector crash in 2000.
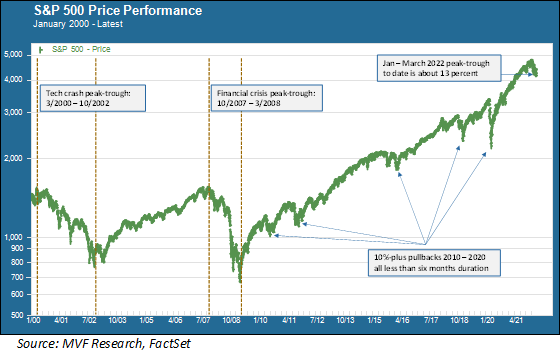
Two Long, Five Short
As the above chart shows (which presumably is not news to you) there were two major bear markets in this period: the one that started with the dot-com crash in 2000 and then the 2008 financial crisis that really fell apart with the bankruptcy of Lehman Brothers. Apart from these two seminal events there were five instances where the market fell by more than 10 percent but also recovered relatively quickly. These were the financial crisis in the Eurozone (2010 and 2011), a sharp economic slowdown in China (2015), fallout from the Fed’s interest rate hikes in 2018 and, of course, the pandemic in 2020 (technically, the 34 percent peak-trough fall during March 2020 constituted a bear market, but the lightning-speed bounceback after the Fed’s intervention makes this materially different from 2000-02 and 2007-09).
Now, if you look to the far right side of the above chart you will see the current pullback. At the March 8 close, the S&P 500’s low point thus far, the index was off about 13 percent from its January 3 high. A peak – trough duration of two months is pretty comfortably within the range of those previous five events from 2010 – 2020 that didn’t extend into a longer, more painful experience. But, of course, we don’t know with any level of assurance that the March 8 close will wind up being the definitive bottom for this event.
A Closer Look at 2000
It is customary market shorthand to refer to the 2000-02 bear market as the “tech crash” because of the outsize impact of the meltdown in Internet stocks that occurred early in this event. But while the dot-com implosion gobbled up the likes of Pets.com very quickly, the trend in the broader market is actually a lot more complex. Below we show the S&P 500 from January 2000 to December 2002.
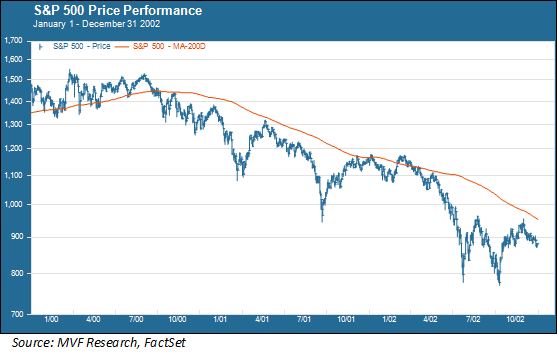
After peaking in March 2000, the S&P 500 did fall sharply in the initial downdraft from the tech crunch. On April 14 the index fell by nearly six percent in a single day (by contrast, the worst single day for the index in the present-day environment was a 2.95 percent slide on March 7). But then, as you can see, things stabilized and the S&P 500 actually flirted with the March 24 high several times later on in the year (this all taking place while the wheels continued to come off anything tainted by the dot-com association). Things didn’t start going really south for the S&P 500 until February 2001. By then it was becoming evident that the economy was headed for a recession. The Fed started a rapid series of interest rate cuts in January 2001 to try and head off the building evidence of economic weakness, but that seemed to only unsettle the market even more (yes, interest rate cuts don’t always bail out falling stock prices).
A further hit came with the terrorist attacks of September 11, 2001, which in the end was probably more damaging at a psychological level on market sentiment than in terms of an actual economic effect. In any event, the combination of these factors – tech’s woes, the recession and 9/11 along with no doubt other evanescae that have faded from memory but that were probably seen as important at the time – was enough to keep stock prices depressed until the S&P 500 bottomed out in October 2002.
Lessons for Today
Does the 2000-02 experience have any implications for today? Let’s fast-forward to the FOMC meeting this week in which the Fed raised interest rates for the first time in more than three years. Because the question about whether the market pullback of January – March 2022 turns into something more persistent hinges a great deal on whether what Fed chair Powell said about the economy in the press conference following the meeting on Wednesday actually comes to pass.
The interest rate hike and those slated to follow are necessary to tame inflation – which, says Powell, is job number one for the Fed. Not only necessary but, in his view, sufficient. The supply chain problems and the added uncertainty brought about by the war in Ukraine will, in time, work themselves out according to this view. Meanwhile the labor market is strong, consumer demand remains healthy and thus the likelihood of a recession in the next twelve months is low. This is the world according to Jerome Powell, and if he is correct in his assessment then (absent some other threat that has not yet manifested) the likelihood of a repeat of the 2000-02 market environment is commensurately low.
That is still a big “if” though, and what bears particularly close scrutiny is whether the labor market can continue to add jobs and keep unemployment around the 3.5 percent level (like the Fed expects) without triggering the kind of endemic wage growth that would in turn make it less likely for inflation to subside back down towards the Fed’s two percent target. That’s the potential wrench in what is otherwise a fairly compelling case for the continuation of solid real economic growth. It will require close attention as we head into the second quarter and beyond – because nobody wants to see a repeat, or even a rhyme, with the history of 2000-02.