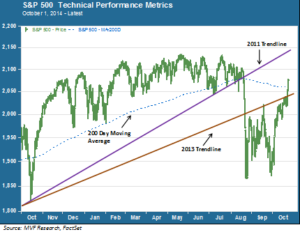
Investors in US large caps have more treats than tricks in their candy bags so far this October. Since testing the current correction’s lows in late September, the S&P 500 has rallied by a bit more than 9 percent, and seems poised to extend those gains even further heading to the Friday close. The index has managed to repair much, though not all, of the technical damage sustained during this pullback. The chart below highlights some of the salient features of this pullback and recovery period.

Back to Black
Notably, as the chart illustrates, the S&P 500 has moved back above its 2013 trendline (i.e. the trend off the previous low water marks going back to 2013) and also above the key 200 day moving average. Always remember that there is nothing magical about any of these trendlines or moving averages. But in the perception-is-reality world of short-term trading they do tend to call the algorithm bots to action, and are thus useful as technical metrics. Next obstacle to surmount is the trendline from the last correction of more than 10 percent, in 2011. That’s also right about where we are likely to experience some resistance from the sideways corridor that kept stocks range-bound from February to the August pullback.
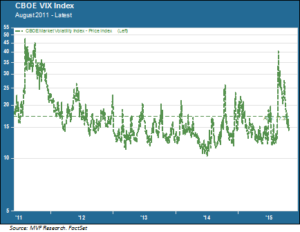
Volatility has also subsided rapidly. Compare the performance of the CBOE VIX index, the market’s so-called “fear gauge”, in the current environment with that of the 2011 correction:

The magnitude of the VIX’s spike was similar in the 2011 and 2015 corrections, but the fear gauge stayed higher for much longer in the former. Fully three months after the initial shock in August 2011, the VIX was still habitually closing over 30 (indicating an unusually high risk environment). This time around, the index is back in the docile mid-teens just two months after the initial onset, and has not risen above 20 since October 6. In many ways, this pullback looks somewhat more like the 2014 flash in the pan – the famous “Ebola freak-out” – than it does the more substantial 2011 correction.
With all that said, the key question on everyone’s mind is what happens next. We have a handful of potential scenarios in play as we look through the rest of this quarter and start to plan for next year. Although we certainly cannot rule out another downturn, we think there is a reasonable case for more upside ahead. Two possible variations of an upside scenario are: a rally led by high quality large caps; or a broad-based melt-up. Which of these (if either) may plausibly be more likely?
The Case for Quality
In some areas of the market we are already seeing a quality rally – or at least an environment where shaky business models are feeling the heat. In other words, the market is starting to do what it did not do very much of during the peak Fed-driven rallies of 2013-14: make a distinction between companies with a demonstrated competitive advantage in a rapidly changing economic landscape, and those more vulnerable to the potential negative consequences of such change.
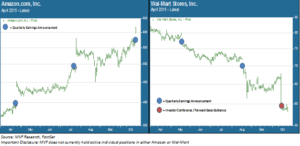
This trend is particularly notable in the consumer sector. Consider the relative performance of two competitors which have been prominent in the news of late: Amazon and Wal-Mart. The chart below shows their respective price trends over the past seven months.

Now, this comparison is only one slice of the market and does not necessarily a dominant trend make. But we are starting to see the market make sharper distinctions between potential winners and losers in the war for consumer dollars and brand loyalty. Wal-Mart knows this terrain well: arguably the last major paradigm shift in consumer retail was its own domination of the big box space through its tight, efficient control of every stage of the supply chain. For that it has been amply rewarded by the market over the years. But Wal-Mart is a laggard as online becomes the dominant trend – barely 2.5 percent of its total sales come from e-tail. Investors appear increasingly skeptical about the company’s ability to make a serious bid for share against the Amazons of the world.
As this dynamic plays out in consumer, tech and other key sectors, 2016 could be the year of the old-fashioned rally where fundamental analysis and stock selection actually pay off. But that is not the only possible outcome.
The Case for Melt-Up
Alan Greenspan memorably uttered the phrase “irrational exuberance” in 1996, a time when the stock market had been soaring along without a care in the world for nearly two years. The sentiment was right, but the timing was off. The market would hit some event-driven speedbumps in the next two years, including a major event-driven correction of more than 19 percent in 1998 that caused immense amounts of hand-wringing. As we all now know, those who panicked in ’98 missed out on one of the great melt-ups of all time in 1999. Melt-ups happen when the money that has sat on the sidelines during an extended bull run finally decides to get in and make up for lost time.
While it would be a stretch to make too much of a comparison between 1999 and 2015, there are some factors which could help pave the way for a melt-up. Easy money leads the way: from the Eurozone to China, and possibly Japan later this month, the central bank spigots are poised to flow at maximum strength. The bond market appears increasingly doubtful that the Fed will follow through with a rate hike in 2015, or even into the first quarter of next year. In this environment a short-term cyclical recovery in emerging markets would be plausible, with hot money flowing back into recently beaten-down destinations in Latin America and Asia Pacific. In this case the quality rally we described above may not materialize, as the Johnny-come-latelies indiscriminately chase anything that moves.
The rational side of our brains tells us that the quality rally is the more logical scenario to plan for. But we also know that markets are generally far from rational, and we cannot rule out the possibility of a wild melt-up. Or, of course, something else entirely. These are interesting times, to say the least.