
MV Weekly Market Flash: Quarterly...

It has been called the window into the soul of the modern economy; the headline macroeconomic data point against which all others are measured. Many claim that Gross Domestic Product fails to capture a large part of what actually constitutes progress in the living standards of human beings around the world, yet there are as of yet no widely accepted methodologies for a more comprehensive measure. So the brainchild of economist Simon Kuznets, GDP’s founding father back in the dark days of 1937, remains our best proxy for the contribution of individuals, businesses and government entities to our economic well-being. All this by way of saying that today’s third quarter GDP release (preliminary) showed a pleasing upside turn after a disappointing first half of 2016. While the quarterly 2.9 percent spurt gives further support to the likelihood of a December Fed funds rate hike, though, today’s report sheds little light on the continuing mystery of where all the growth has gone.
The Trend Is Not Your Friend
Quarterly GDP releases are subject to considerable variance as they go through the iterative process of revisions before the final number is etched into the record books. We focus instead on the bigger picture: how strong is economic growth today, more than six years into the current economic recovery, relative to where it has been at a similar point in previous recovery cycles? The chart below shows year-on-year GDP growth for each quarter (for example, 3Q2016 compared to 3Q2015) from 1950 to the present.
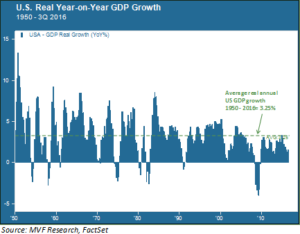
In this context, the most remarkable thing about the current (2009 – present) recovery is that it has only once even grazed the long term real growth average for the past sixty six years of 3.25 percent. In other words, the current growth trend is far and away the weakest of any recovery cycle in the post-World War II economy. Now, this recovery came off the worst economic downturn since the Great Depression. But compare the rate of recovery in the first post-recession years of 2009-10 to that of 1983-84. Then, after the wrenching double-dip recession that spanned 1980-82, year-on-year GDP growth rates ran in the high single digits before settling down to a comfortable trend rate in the four to five percent range. The booming economy of the 1990s was characterized by fewer extreme outliers, but a consistent run rate above the long term average. But growth in the 21st century, thus far, bears little resemblance to its 20th century counterpart.
The Mystery Lies Not in GDP
The long term growth mystery is not why GDP has been so persistently low. That is relatively easy to answer. Economic output – which is what GDP measures – is a fairly simple formulation: the aggregate number of hours employed by working hands to produce things, and the value of things those hands can produce for each hour worked. That formulation, in turn, depends on just three things: (a) growth in the overall population; (b) growth in the percentage of the population employed in the labor force; and (c) the productivity of the labor force.
For example, a significant contributing factor to the strong GDP growth of the 1980s was the rise of labor force participation as a percentage of total population. That trend was driven primarily by the large scale entry of women into the full-time work force – a one-off growth phenomenon that peaked in the early 1990s.
By contrast, the underlying driver of growth in the booming 1990s was a resurgence of productivity, as earlier technological innovations facilitated the ability for workers to produce more in each hour worked than they had before. This was partly due to the delayed impact of 1970s-era technologies like personal computers, and partly due to business process innovations like supply chain optimization and integrated enterprise resource planning.
Productivity, Where Art Thou?
The mystery underlying today’s anemic growth rate is all about productivity; specifically, why it is not only below trend but has actually been negative for much of the recent recovery period. The chart below shows the thirty year trend in labor productivity alongside the concurrent decline in the labor force participation rate.
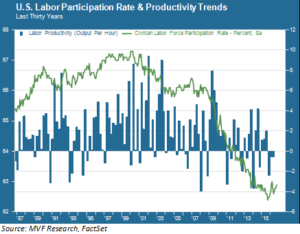
This decline in labor force participation and chronically low productivity are all we need to know to understand why GDP remains so persistently below trend – and why periodic upside surprises like today’s Q3 release don’t shed much light on the bigger picture. One quarter of brisk goods exports and business investment in structures – the catalysts for today’s outperformance – does not a sustainable growth trend make. What we do not know – the mystery in other words – is if and when any of the innovations of the past decade will show up in the form of higher productivity. The answer to that riddle will likely determine whether GDP ever finds its way back to those brisker 20th century norms.
The third quarter number – with whatever revisions happen between now and then – will be the most recent growth data point for the Fed to consider when they weigh the prospect of a rate hike in December. Assuming no negative surprises between now and then – either surprises from other headline macroeconomic numbers or a major pullback in risk asset markets – odds are good they will go ahead with a 0.25% move. We believe that will be the right thing to do. But this larger growth question will persist beyond December and will, in our opinion, be a major factor at play in shaping market performance in 2017.