Stock prices didn’t exactly surge this week, even as the S&P 500 finally set a new record high on Tuesday and thus, for the moment anyway, formally ended the shortest bear market in the history of the world. On that record-setting day there were actually more stock prices in decline than advancing. But, as is so often the case, it was the Fabulous Five of Amazon, Apple, Microsoft, Alphabet and Facebook, with their combined heft of about 25 percent of the index’s entire market value, that pushed the ball over the goal line. And so began yet another round of debates among the chattering class of the financial marketplace about just how overvalued stocks are.
Overvalued relative to what, exactly? That is what we will be looking at this week.
The P/E and its Mirror Image
Often, when we say a stock is overvalued we mean that its price is high relative to some fundamental measure of the company’s financial performance, like price-to-earnings (P/E) or price-to-sales (P/S). And by these traditional measures stocks are very expensive. The P/S ratio of the S&P 500 today is 2.44 times, almost exactly where it was in March 2000 at the peak of the technology bubble. Put another way, only once before in history has the overall market been as expensive as it is today.
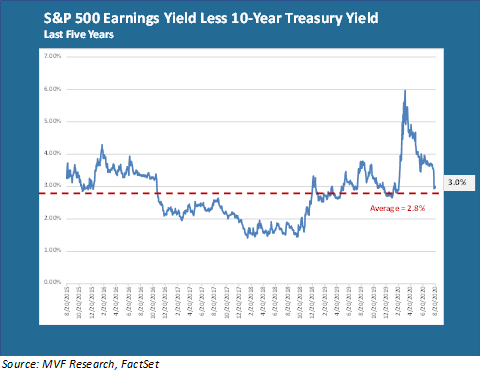
But there are other ways of looking at value. If you turn the P/E ratio upside down you get another metric: the earnings yield, representing a company’s net profits divided by its share price. You can then compare this to the yield on some other type of security – say, for example, Treasury bonds. In the chart below we show this very comparison: the earnings yield of the S&P 500 less the yield on the 10-year Treasury.

Many Moving Parts
So what is that chart telling us, and is there an argument in there that perhaps stocks are not as expensive as they might otherwise seem? Well, yes and no. Let’s break it down a bit further.
What seems fairly clear from that chart is that the relative yield on stocks versus bonds at the present time is not particularly out of line with longer-term norms. The earnings yield on the S&P 500 is around 3.64 percent, while the 10-year Treasury currently (as of yesterday) was fetching a yield of 0.64 percent. Subtract one from the other and you get 3 percent, which in turn is just above the 5-year average of 2.8 percent. Relative to bonds, in other words, stocks are neither unduly expensive nor particularly cheap.
That’s a fine argument as far as it goes – but in some ways it is also not an apples-to-apples comparison. The yield on an ultra-safe bond like a Treasury security is basically a very low-risk stream of income, all of which the investor receives simply by holding the bond. The earnings yield of an equity security is another thing entirely. Holding a share of common stock gives the investor a theoretical claim on the earnings associated with that share. But it is the company’s discretion what to do with those earnings: reinvest them into the company or pay out a portion in the form of dividends. As a shareholder, in other words, your claim on those earnings is much more tenuous than that of a bondholder’s interest payments (which, in turn, is why you would naturally expect stocks to return more than bonds to compensate for that additional risk).
There is also something of a circular argument going on if one uses relative yields to make the case that equities are not overvalued. Think about the earnings yield formula: earnings divided by price. In the past six months the denominator of this equation – the price of the S&P 500 – has gone up more than 50 percent. At the same time the numerator — earnings — has fallen for two consecutive quarters. Both of these trends have the effect of depressing the earnings yield. But it is a bit of a stretch to argue that stocks are not expensive specifically because rising stock prices have made the earnings yield lower!
Who’s Right?
As usual, there is no hard and fast right or wrong answer here. No one single valuation measure – not price-to-sales, not the earnings yield, not some other thing – supplies a definitive answer to the question of how to position one’s portfolio. Every investor has a specific set of financial objectives built around three considerations: growth, protection of capital, and income. Looking at different measures of value – and, importantly, breaking them down into their component parts – helps to supply different pieces of the puzzle. For example, a historically high price-to-sales ratio might suggest that protection of capital is a near-term concern, and perhaps it is time to carefully rotate out of some of the more stretched parts of the market into areas of better relative value. On the other hand, consideration of the relative yields between stocks and bonds would inform an income-seeking investor that safe bonds are a bad place to be right now and stocks look relatively attractive (this, by the way, is the widely understood although never explicitly stated objective of central banks in their monetary stimulus programs).
Often this kind of analysis turns up more questions than answers. And that’s our job every day – to ask the hard questions, challenge our thinking and look below the surface to ensure we are leaving no stone unturned to help us make the right decisions for our clients and the money they have entrusted to us.