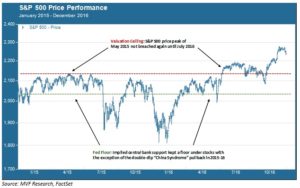
As we wind our way through the random twists and turns of the first quarter, a couple things seem to be taking on a higher degree of likelihood and importance than others: (a) the Fed is back in the game as the dice-roller’s best friend, and (b) corporate earnings are starting to look decidedly unfriendly for fiscal quarters ahead. And we got to thinking…have we seen this movie before? Why, yes we have! It’s called the Corridor Trade, and it was a feature of stock market performance for quite a long time in the middle of this decade. Consider the chart below, which shows the performance path of the S&P 500 throughout calendar years 2015 and 2016.

What the chart above shows is that from about February 2015 to July 2016, the S&P 500 mostly traded in a corridor range bounded roughly by a fairly narrow 100 points of difference: about 2130 on the upside, and 2030 or so on the downside. There were two major pullbacks of relatively brief duration during this period, both related to various concerns about growth and financial stability in China, but otherwise the corridor was the dominant trading pattern for this year and a half. Prices finally broke out on the upside, paradoxically enough, a few days after the UK’s Brexit vote in late June 2016. An overnight panic on the night of the Brexit vote promptly turned into a decisive relief rally because the world hadn’t actually ended, or something. A second relief rally followed the US 2016 elections when collective “wisdom” gelled around the whimsical “infrastructure-reflation” trade that in the end produced neither.
So what was this corridor all about? There are two parts: a valuation ceiling and a Fed floor.
Corridor Part 1: Valuation Ceiling
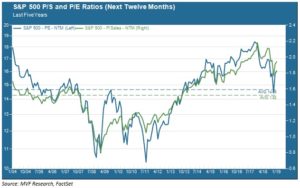
In 2015 concerns grew among investors about stretched asset valuations. Earnings and sales multiples on S&P 500 companies were at much higher levels than they had been during the peak years of the previous economic growth cycle in the mid-2000s. The chart below shows the price to earnings (P/E) and price to sales (P/S) ratios for the S&P 500 during this period.

Those valuation ratios were as high as they were during this time mostly because sales and earnings growth had not been keeping up with the fast pace of stock price growth in 2013 and 2014. While still not close to the stratospheric levels of the late-1990s, the stretched valuations were a cause of concern. In essence, the price of a stock is fundamentally nothing more and nothing less than a net present value summation of future potential free cash flows. Prices may rise in the short term for myriad other reasons, causing P/E and P/S ratios to trade above what the fundamentals might suggest, but at some point gravity reasserts itself. That was the valuation ceiling.
Corridor Part 2: The Fed Floor
The floor part of the corridor is just a different expression for our old friend, the “Fed put” begat by Alan Greenspan and bequeathed to Ben Bernanke, Janet Yellen and now Jerome Powell. Notice, in that earlier price chart, how prices recovered after both troughs of the double-dip China pullback to trade again just above that corridor floor level. The same thing seems to be happening now, with the extended relief rally that bounced off the Christmas Eve sell-off. The floor is a sign of confidence among market participants that the Fed won’t let them suffer unduly (which confidence seems quite deserved after Chair Powell’s capitulation at the end of last month). It is not clear yet where the floor might establish itself. Or the ceiling, for that matter. Might the S&P 500 reclaim its September 20 record close before hitting a valuation ceiling? Maybe, and then again maybe not.
What we do know is that bottom line earnings per share are expected to show negative growth for the first quarter (we won’t find out whether this is the case or not until companies start reporting first quarter earnings in April). Sales growth still looks a bit better, in mid-single digits, but we are already seeing corporate management teams guiding expectations lower on the assumption that global growth, particularly in Europe and China, will continue to slow. Meanwhile price growth for the S&P 500 is already in double digits for the year to date. That would appear to be a set-up for the valuation ceiling to kick in sooner rather than later.
Could stock prices soar another ten percent or even more? Sure they could. The stock market is no stranger to irrationality. A giddy melt-up is also not unknown as a last coda before a more far-reaching turning of the trend. But both elements are pretty solidly in place for a valuation ceiling and a Fed floor. A 2015-style Corridor Trade will not come as any surprise should one materialize in the near future.