Well, that was interesting.
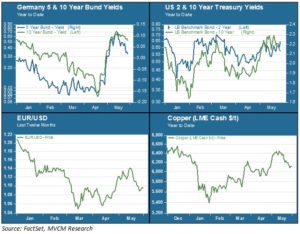
On April 20, all the chatter among bond traders was about the imminent plunge of 10-year German Bund yields into negative territory. Instead they were caught off guard by a sudden, steep and seemingly inexplicable reversal. The 10-year yield doubled within two days, on its way to a stunning eightfold gain by mid-May. Meanwhile the 5-year yield, which had languished in negative territory since the beginning of the year, broke through the zero bound on its way to a peak of 0.11%. Other assets reacted accordingly. US Treasury yields jumped, the euro broke out against the dollar, and commodity prices gained.
No Friend, This Trend
Then, just as quickly as it began, it was all over. As the chart below shows, the sharp reversals that began in late April reached a peak in mid-May. With barely a pause to enjoy the view from on high, the reversals reversed. Eurozone yields, the euro and commodities fell in tandem. The 10-year Treasury also pulled back from its mid-May high though, interestingly, the 2-year yield remains elevated.

All this has resulted in a collective head-scratching among market observers, particularly with regard to what drove that initial sudden spike in Bund yields. Some pointed to liquidity concerns as a result of increased ECB purchases, while others posited the incongruence of negative yields with somewhat improving Eurozone growth and inflation prospects. A handful of weaker than expected data points in the US may have helped the dollar’s decline. None of these explanations, though, make a convincing case for the timing and magnitude of the reversal. A more plausible explanation may simply be technical: a bevy of algorithms were programmed to kick in when the 10-year Bund approached zero, and traders duly piled on.
Back to the Periphery
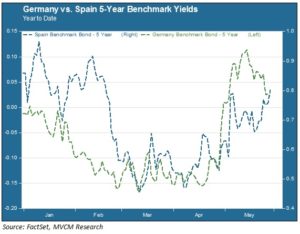
Another curious feature of the April-May reversal was its concentration in the core, rather than the periphery, of Eurozone yields. Peripheral spreads actually tightened against the Bund during this period. The chart below shows the year-to-date trend of the Spanish 5-year benchmark issue relative to the 5-year Bund. Spanish yields rose by less than Bunds through mid-May, but the spread has widened notably since then.

This chart may indicate that things are returning to “normal” in Europe. As investors return their focus to the deteriorating situation in Greece, the risk premium on peripheral debt like Spain increases while the Bund resumes its traditional safe-haven role. The slow pace and contentious nature of the negotiations between Greece, its EU partners and the IMF have increased the potential for a so-called “Grexit”. That day of reckoning is not yet at hand – the IMF has given permission for Athens to delay its June debt payments until the end of the month. But after more than three months of negotiations there is little evidence of convergence towards mutual agreement.
Meanwhile, Back in the US…
If the chart above illustrates a reversion to more typical core-periphery spreads in Europe, we believe it also indicates that US rates will likely decouple from trends in the Eurozone. There was no particular reason for Treasuries to join the European April-May trend; if anything, consensus opinion here has pushed the likely timing of a Fed move further back into the second half of this year, if not later. We will have a better sense shortly as to whether the US weakness is a first quarter phenomenon or a more chronic ailment. That, in turn, will give us a better sense as to where rates here are headed.