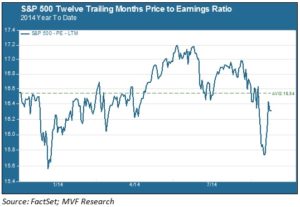
For a brief few intraday trading moments last week the S&P 500 fell below the level of 1848 (year of revolutions!) where it started 2014. The ensuing v-shaped rally has pushed the index fairly comfortably back into positive territory. But the price-equity (PE) ratio remains a bit below where it opened the year; the twelve trailing months (TTM) PE ratio as of October 23 is 16.3 as compared to 16.5 at the beginning of January. The chart below shows how the PE ratio has trended over the course of this year.

What the PE Ratio Tells Us
The PE ratio is a valuation metric. Think of it as a yardstick for how much investors are willing to pay for a claim on a company’s earnings. For example, a PE ratio of 10x at ABC Company means that investors are willing to shell out $10 for each dollar of ABC Company’s net earnings per share (EPS). If the PE goes from 10x to 12x it signifies that investor perceptions of ABC company have improved; they are now willing to pay $2 more for that same dollar of earnings. A fall in the PE – say from 10x to 8x – would mean the opposite. Value investors, in particular, analyze companies with low PE multiples (relative to the market or their industry peer group) to see if there is a bargain to be had; to see whether there is value in the company that the market, for whatever reason, is not recognizing.
The Multiple and Its Message
Bringing the discussion back to the above chart, it would seem that investors’ attitude towards stocks in general isn’t far today from where it was in January. There were a couple rallies that pushed the PE higher and a couple pullbacks that brought it back down, but over the course of the year the multiple has repeatedly reverted towards the mean (average) level of 16.5x. In our opinion there is a good reason for this, and potentially a message about where stocks may be heading as we start planning our allocation strategy for 2015.
The consensus growth estimate for S&P 500 earnings in 2014 is around 6%; in other words, earnings per share on average should be around 6% higher at the end of the year than they were at the beginning for the companies that make up the index. As it happens, 6% is not too far from the index’s price appreciation this year. We would not be surprised to see this relationship still largely intact as the year closes: a positive year for stocks in which the PE multiple neither expands nor compresses, with mid-upper single digit gains for both share prices and earnings.
Still Not Cheap
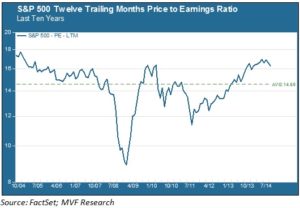
The recent pullback has done little to change the fact that stocks are still expensive, on average, relative to long term valuation levels. In the chart below we see the same PE ratio as in the first chart, but the time period goes back ten years to October 2004.

For the last ten years the average TTM PE ratio was 14.6x, considerably below the current level of 16.3x. Remember that the higher the PE, the more expensive the market. In fact, prices are currently higher than at any time since 2005 (we should note, though, that they are still far below the stratospheric levels achieved in the final frenzied years of the late ‘90s bull market). This prompts us to recall the title of the 2014 Annual Outlook we published back in January: “How Much More?” In other words, how much more multiple expansion could we expect to see given how high the multiple already is?
For the past three years the Fed has been the driving force behind an across-the-board rally in U.S. and, mostly, global equities. With QE3 coming to an end (probably) and rates heading slightly higher next year (probably), stocks will be left more to their own devices. We think it reasonable to assume a base case of positive growth in share prices more or less in line with earnings; in other words, a continuation of the 2014 trend. We also see a good case to make for a return to focus on quality and selectivity – companies with solid cash flows and robust business models – rather than an indiscriminate buy-everywhere approach. We may be wrong. Late-stage bull markets can lure cash in from the sidelines and expand PE levels ever higher, as in 1998-99. Conversely, any number of things from Europe’s economy to a China slowdown to worsening geopolitics could spark more broad sell-offs. When we establish a base case we do so with several alternative scenarios. Our thinking may change – we are data-driven and not ideological. But right now, growth without much multiple expansion seems plausible.