Fed-watching isn’t quite the sport it was one year ago. The investing herds these days tend to be more fixated on tweets than on dot-plots. Nonetheless, the FOMC will meet again in eleven days, and what they decide to do (or not do) in January and beyond will have an impact on fixed income portfolios. The consensus wisdom is that rates are likely to rise. But direction is only one aspect of managing interest rate exposure; the other is shape – as in shape of the yield curve. Short and intermediate term rates have done anything but move in lockstep over the past several years. We think it is a good time to step back and consider the variables that may be at play in influencing the shape of the curve in the coming months.
Greenspan’s Conundrum
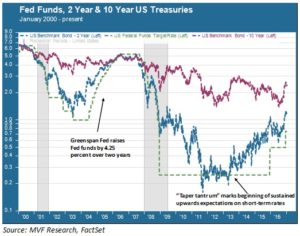
A very odd thing happened the last time the Fed engineered a sustained policy of rate increases. The chart below shows the Fed funds target rate going back to 2000, along with the 2-year and 10-year Treasury yields.

The Greenspan Fed began raising rates in June 2004, taking the Fed funds target rate from 1.0 percent to 5.25 percent over a two year period (the green dotted line on the chart shows this ascent). Short term market rates moved accordingly; the 2-year yield started moving up ahead of the Fed, probably due to the expectations game and a sense that economic recovery was at hand. Longer term rates, though, barely moved at all. In fact, by the time the policy action topped out, the yield curve was essentially flat between 2-year and 10-year maturities.
Greenspan pronounced himself confused by this and called it a “conundrum.” His successor Ben Bernanke had done his own homework, though, and figured out what was going on. Many central banks around the world, particularly in Asia, had been burned by the currency crisis of 1997 and subsequently embarked on disciplined programs of building up their foreign exchange reserves. Meanwhile China, which had emerged relatively unscathed from the ’97 crisis, had its own reasons for stockpiling FX reserves: it was a means of keeping its domestic currency from getting too expensive while the country’s value of exports soared. What are all those FX reserves comprised of? Treasury securities, mostly. So the Greenspan conundrum was nothing more than good old fashioned supply and demand; as foreign central banks built up ever-higher mountains of reserves, the demand kept Treasury prices up and yields down. The effect was more pronounced at the intermediate and long end of the curve, which tend to be less influenced by domestic monetary policy and more influenced by other economic variables.
Bernanke’s Taper
As the above chart shows, the expectations game with short-term rates has had some crazy moments in the past few years. Note, first of all, that the 2-year did not follow the Fed funds rate all the way down to zero as the central bank responded to the 2008 recession and market crash. The 2-year hung around the one percent level for much of the time until the second half of 2010 – the time leading into when the Fed launched its second wave of quantitative easing. The 2-year finally converged with the Fed funds (the upper band of the zero – 0.25 percent range) after the Eurozone crisis and debt ceiling debacle of summer 2011.
But the expectations game began anew in 2013 when then-Chair Bernanke mused openly about tapering the QE activity, Since that time, despite a handful of reversals, the trend in short-term rates has been resolutely higher. Market expectations ran ahead of the Fed, falling back only in 2016 when the FOMC blinked on successive occasions and held off on rate increases.
Yellen and the Tweets
While short term rates moved decisively off their 2011 and 2013 lows, intermediate rates once again behaved very differently. The 10-year yield actually set an all-time low in 2016 – yes, that was the cheapest 10-year debt has ever been in the history of the American republic. Again, the culprit appears to be supply and demand. In an age of negative interest rates, the meager two percent yield is king. Demand from institutional investors like insurance companies and pension funds, pushed out of other sovereign markets from the Eurozone to Switzerland and Japan, allocated larger chunks to intermediate and long Treasuries.
What does this mean for the remainder of 2017? A rational assessment of short-term movements, based on where rates are today and assuming the Fed goes through with at least two more rate hikes over the year, is that short-term rates might nudge up another 50 basis points or so. At the short end of the curve we think floating rate exposure remains attractive as a defense, particularly if the expectations game gets ahead of itself again.
The bigger challenge lies in those intermediate exposures. Negative rates still persist in Swiss and Japanese 10-year paper, but intermediate Bunds have trended decisively higher in recent weeks. The reflation trade that took hold right after the US election has meanwhile pushed the 10-year Treasury within striking distance of three percent. If the first month or so of the new administration gives the market cause to wrap itself even more tightly around this theme, then it may be a very painful year for fixed income portfolios. On the other hand – and we tend to see this as a more likely possibility – if the Trump trade is already overextended then we would expect to see less drama in the middle and long end of the curve, and still-healthy demand from those yield-seeking institutions.
An orderly and gradual rate increase policy was no doubt at the top of Janet Yellen’s list of New Year wishes. The overall economic environment would seem ready to cooperate with that intention. But she will have to deal with the possibility that tweets will do more to shape the curve than will dot-plots.