Financial markets move to the metronome of data, but not only data. Optics and perception also factor into the equation. Experience tells us that perception can quite easily become reality. Thousands of trader-bots are primed on any given day to lurch this way and that, often on the basis of no more than the parsed verbiage of a Fed speech or a “presidential” tweet. Sometimes the waves generated by those bots cross each other and cancel out. Other times they all find themselves going in the same direction and create a tsunami.
When “Buy the Dip” Met “Sell the Rally”
Many of the headline data points continue to suggest that there is little reason to worry. The latest batch of jobs data came out this morning and were not way out of line with expectations – net positive payroll gains and a steady, but not overheated, pace for wage growth. In public statements Fed chair Powell projects confidence about growth prospects heading into next year. But other indicators are flashing yellow, if not necessarily red. Oil prices suggest a tempered demand outlook. Fed funds futures contracts are sharply backing away from the presumption of three rate increases next year and perhaps even a shift back to rate cuts in 2020. The picture for global trade remains as opaque as it has been for much of the year, leading to reductions in 2019 global growth estimates by the IMF.
With that in mind, it seems increasingly plausible that the current volatility in risk asset markets is something different from the other occasional pullbacks of the past few years. This one is more grounded in the perception that an economic slowdown is ahead. Not “tomorrow” ahead or “next January” ahead, but quite plausibly sometime before the calendar closes on 2019. What we’re seeing in this pullback (for the time being, anyway) is a roughly balanced approach to buying the dips at support levels and selling into relief rallies at the resistance thresholds. Having made it through a negative October without the bottom falling out, the animal spirits to propel a sustained upside rally are thus far being kept in check. Perception is running ahead of actual data, as it frequently does.
Pick Your Flavor
None of this means that a slowdown (or worse) is absolutely, definitely in store in the coming months. But if it seems like an increasingly probable outcome, how does one prepare? There is never any shortage of blow-dried heads in the media to tell you that “when the economy does X the market does Y” with “Y” being whatever pet theory its proponent is hawking on the day. The problem is that there is no statistical validity to any kind of pattern one might discern between slow or negative growth in the economy and the direction of stock prices. There simply aren’t enough instances for an observation to be meaningful. The US economy has technically been in recession just five times since 1980 (two of which were arguably one event, the “double-dip” recession of 1980-81). There’s no statistical meaning to a sample size of n=5, just like flipping a coin five times does not give you the same insight that flipping a coin 10,000 times does.
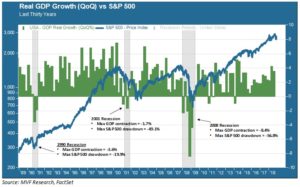
The last three recessions occurred, respectively, in 1990, 2001 and 2008. The chart below shows the trend in real GDP growth and share price movements in the S&P 500 over this period.

Here is what jumps out from the above chart: the pullback in the stock market during the relatively mild recession of 2001 was much more severe than the one that accompanied the deeper recession of 1990. Consider: 2001 barely even made it into the history books as a technical recession (the story of how recessions become official makes for an interesting article in and of itself – stay tuned for our 2019 Annual Outlook this coming January!) Yet the bloodbath in stocks was a sustained bear market over nearly three years. By contrast, the market fell just short of, and never technically went into, a bear market during the 1990 recession. 2001 was closer in terms of damage done to the Big One, the Great Recession of 2008.
Tolstoy’s Economy
Here is where we come back to our favorite hobby horse: inferring useful meaning from past instances is misguided, because each instance has its own miserable set of unique variables, like every unhappy family in “Anna Karenina.” Before the 2001 recession happened, you will recall, the high-flying technology sector crashed in a stunning mess of shiny dot-com valuations. A financial crisis – a crisis born of nosebleed asset valuations – precipitated a minor contraction in the real economy. And of course in 2008 it was another financial crisis, this one deeper and holding practically the entire global credit market in its grasp, that begat the near-depression in the economy that followed.
We think of 2001 and 2008 as “recession-plus,” where the “plus” factor arguably contributes more to the severity of the pullback in risk assets than do the macroeconomic numbers relating to jobs, GDP, prices and sales. It was no fun for investors as those numbers turned south in 1990, but the pain was relatively shallow and short-lived. Not so for the multi-year tribulations of 2001 and 2008.
Now, there is no clear path from where we stand today to either a 1990-esque standalone recession, a more severe situation driven by exogenous factors, or just a simple slowdown in growth. Or even (though less likely) a second wind of the growth cycle driven by a yet-unseen burst of productivity. Nor has perception, while currently trending negative, yet become reality. We imagine those bot-generated waves will collide and cancel out a few more times before the trend becomes more sustainably directional. Meanwhile, planning for alternative scenarios is the priority task at hand.