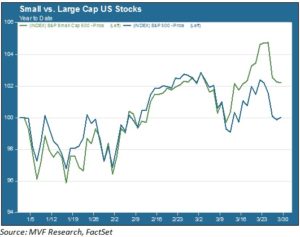
Large cap US stocks are barely treading water for the year to date; the S&P 500’s marginally positive return of 0.34% through Thursday’s close derives entirely from dividends. Meanwhile, small cap stocks have opened up a comfortable performance gap relative to their larger cousins. The S&P 600 small cap index is up 2.6% year to date. That’s hardly a barnstorming show of strength, but it does provide a welcome port of call in the generally choppy seas the capital markets have served up this year. Small caps may be in favor for a handful of reasons: comparative immunity from the soaring dollar’s collateral damage and mean-reversion after last year’s underperformance are two popular arguments. Is it too late to reap benefits from a tactical venture into small cap land?
Small Caps and the Dollar
The chart below shows the relative performance trend of large caps and small caps so far this year. The indexes tracked closely for much of this time, but small caps were a bit quicker pulling out of the early March pullback, and went on to chart new record highs while the S&P 500 hit resistance headwinds.

That March time period also coincided with another mini-rally in the dollar. The greenback jumped against the euro in the wake of the March 6 jobs report, bolstering the case that a strong dollar is an established feature of the intermediate term landscape. Since smaller companies on average derive a smaller portion of their revenues from overseas, investors tend to see small caps as less vulnerable to the FX headwinds that have thrown a wet blanket on large companies’ recent earnings reports.
But currency doesn’t seem to be the whole story here. After all, the dollar rallied strongly against most currencies in January, yet, as the above chart shows, small caps were not outperforming then. To understand more of the dynamics at play, we need to break down the small cap universe into its growth and value components. Style trends appear to be a more decisive factor than the currency impact.
Sector Drivers
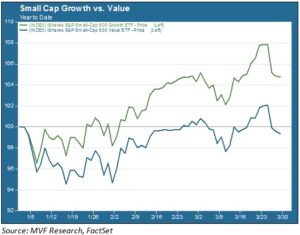
In the chart below we see the relative performance of small cap value and growth for the year to date. This shows a style breakout that started well before small caps overall gained the upper hand over large caps.

A simple explanation to the divergence of value and growth styles lies in relative sector exposures. Two of the best-performing sectors for much of this year – healthcare and technology – account for about 35% of the S&P 600 small cap growth. Conversely, over 40% of the small cap value index is made up of financials and industrials, both of which have somewhat lagged the market this year. In fact, the entire small cap vs. large cap outperformance derives from growth stocks; the S&P 600 Value index actually trails the S&P 500 by a small amount year to date.
Bubble, Bubble, Toil and Trouble?
Over the past few days we have seen some jitteriness among names in some of the highest-flying sectors of late, notably biotech. Does this presage an imminent bubble burst? Given the sector exposures we discussed above, a meltdown in key healthcare or technology industries would likely bring a quick end to the growth-driven outperformance gap. On the other hand, there is no particular reason to pin a specific date on the trend reversal, and we’re not yet seeing much data for which value sectors would lead on the reversal’s flip side.
Moreover, while small caps are by no means cheap, a median NTM P/E of 18.6 does not necessarily scream “bubble”. Small caps underperformed large by about 4% on average last year, so a certain amount of mean reversion is likely baked into the current trend. On balance, we continue to see a reasonable case for maintaining a tactical overlay in small caps, with a more or less neutral balance between value and growth.