Spring has come early to the US East Coast this year, with the good citizens of Atlantic seaboard cities ditching their North Faces and donning shorts and flip-flops for outdoor activities normally kept on ice until April. Grilling, anyone? Equity investors, meanwhile, have been enjoying an even longer springtime, full of balmy breezes of hope and animal spirits. But just as a February spring can fall prey to a sudden blast of March coldness, this week has brought a few hints of discontent to the placid realm of the capital markets. Whether these are harbingers of choppy times ahead or simply random head fakes remains to be seen, but we think they are worthy of mention.
Ach, Meine Schatzie!
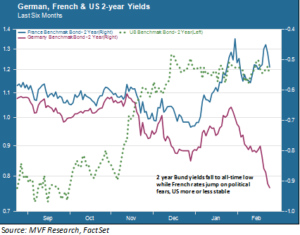
Fun fact: German two year Bunds go by the nickname Schatz, which is also the German word for “treasure” as well as being a cozy term of endearment for loved ones. Well, these little Teutonic treasures have been exhibiting some odd behavior in the past several days. This includes record low yields, a post-euro record negative spread against the two year US Treasury, and a sudden spike in the gap between French and German benchmark yields. The chart below shows the divergent trends for these three benchmarks in the past couple weeks.

The sudden widening of the German and French yields offers up an easy explanation: a poll released earlier in the week showed National Front candidate (and would-be Eurozone sortienne) Marine Le Pen with a lead over presumed front runner Emmanuel Macron. That was Tuesday’s news; by Wednesday François Bayrou, another independent candidate, had withdrawn and thrown his support to Macron, easing Frexit fears. Yields fell back. Got that?
The Schatz yield also kept falling, though, as the dust settled on the latest French kerfuffle. Since German government debt is one of the more popular go-to markets for risk-off trades, we need to keep an eye on those historically low yields. This would be a good time to note that other European asset classes haven’t shown much fretting. The euro sits around $1.06, off its late-December lows, and equity markets have been fairly placid of late (though major European bourses are trading sharply lower today). But currency option markets suggest a growing number of investors positioning for a sharp reversal in the euro come May.
Gold Bugs and Trump Traders Unite
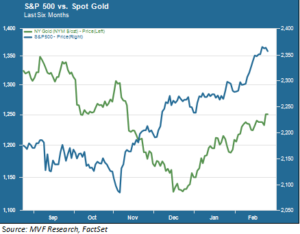
Bunds are not the only risk-off haven currently in favor; a somewhat odd tango has been going on for most of this year between typically risk-averse gold bugs and the caution-to-the-wind types populating the Trump trade. The chart below shows how closely these two asset classes have correlated since the end of last year.

Now, an astute reader is likely to point out that – sure, if the Trump trade is about reflation and gold is the classic anti-inflation hedge, then why would you not expect them to trend in the same direction? Good question! Which we would answer thus: whatever substantial belief there ever was in the whole idea of a massive dose of infrastructure spending with new money, pushing up inflation, is probably captured in the phase of the rally that started immediately after the election and topped out in December. During that phase, as the chart shows, the price of gold plummeted. That would be odd if gold investors were reacting to (higher) inflationary expectations.
Much more likely is the notion that gold’s post-November pullback was simply the other side of the animal spirits; investors dumped risk-off assets in bulk while loading up on stocks, industrial metals and the like. In that light, we would see the precious metal’s gains in early 2017 more as a signal that, even as Johnny-come-lately investors continue piling into stocks to grab whatever is left of the rally, some of the earlier money is starting to hedge its gains with a sprinkling of risk-off moves, including gold.
None of this should be interpreted as any kind of hard and fast evidence that the risk asset reversal looms large in the immediate future. Market timing, as we never hesitate to point out, is a fool’s errand that only ever looks “obvious” in hindsight. An article in the Financial Times noted today that the recent succession of 10 straight “up” days in the Dow Jones Industrial Average was a feat last achieved in 1987, with the author taking pains to point to the whopping market crash that happened the same year. He waited until the end of the article to deliver the punch line: anyone who took that 10 day streak as a sign to get out at the “top” of the market forfeited the 30 percent of additional gains the Dow made after that before its 20 percent crash in October (do the math). Ours is not a call to action; rather, it is an observation that dormant risk factors may be percolating up ahead of choppier times.