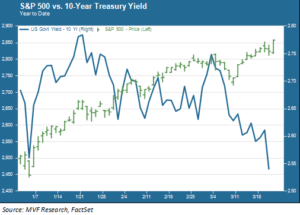
Well, the first quarter of 2019 is about to enter the history books, and it’s been an odd one. On so very many levels, only a couple of which will be the subjects of this commentary. To be specific: stocks and bonds. Here’s a little snapshot to get the discussion started – the performance of the S&P 500 against the 10-year Treasury yield since the start of the year.

Livin’ La Vida Loca
For an intermediate-term bond investor these are good times (bond prices go up when yields go down). For an equity investor these are very good times – the 2019 bull run by the S&P 500 is that index’s best calendar year start in 20 years. There are plenty of reasons, though, to doubt that the good times will continue indefinitely. Something’s going to give. The bond market suggests the economic slowdown that started in the second half of last year (mostly, to date, outside the US) is going to intensify both abroad and at home. The stock market’s take is that any slowdown will be one of those fabled “soft landings” that are a perennial balm to jittery nerves, and will be more than compensated by a dovish Fed willing to use any means available to avoid a repeat of last fall’s brief debacle in risk asset markets (on this point there is some interesting chatter circulating around financial circles to the effect that the equity market has become “too big to fail,” a piquant topic we will consider in closer detail in upcoming commentaries).
Flatliners
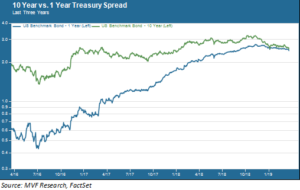
We have been staring at a flattening yield curve for many months already, but we can now dispense with the gerundive form of the adjective: “flattening” it was, “flat” it now is. The chart below shows the spread between the 10-year yield and the 1-year yield; these two maturities are separated by nine years and, now, about five basis points of yield.

Short term fixed rate bonds benefitted from the radical pivot the Fed made back in January when it took further rate hikes off the table (which pivot was formally ratified this past Wednesday when the infamous “dot plot” of FOMC members’ Fed funds rate projections confirmed a base case of no more hikes in 2019). But movement in the 10-year yield was more pronounced; remember that the 10-year was flirting with 3.25 percent last fall, a rate many observers felt would trigger major institutional moves (e.g. by pension funds and insurance companies) out of equities and back into fixed income). Now the 10-year is just above 2.5 percent. Treasuries are the safest of all safe havens, and there appears to be plenty of safe-seeking sentiment out there. The yield curve is ever so close to inverting. If it does, expect the prognostications about recession to go into overdrive (though we will restate what we have said many times on these pages, that evidential data in support of an imminent recession are not apparent to the naked eye).
Max Headroom
What about equities? The simple price gain (excluding dividends) for the S&P 500 is more than 13 percent since the beginning of the year, within relatively easy striking distance of the 9/20/18 record high and more or less done with every major technical barrier left over from the October-December meltdown. “Pain trade” activity has been particularly helpful in extending the relief rally, as money that fled to the sidelines after December tries to play catch-up (sell low, buy high, the eternal plight of the investor unable to escape the pull of fear and greed).
The easy explanation for the stock market’s tailwind, the one that invariably is deployed to sum up any given day’s trading activity, is the aforementioned Fed pivot plus relaxed tensions in the US-China trade war. That may have been a sufficient way to characterize the relief rally back from last year’s losses, but we question how much more upside either of those factors alone can generate.
The Fed itself suggested, during Wednesday’s post-FOMC meeting data dump and press conference, that the economic situation seems more negative than thought in the wake of the December meeting. The central bank still appears to have little understanding of why inflation has remained so persistently low throughout the recovery, but finally seems to be tipping its hat towards the notion that secular stagnation (the phenomenon of lower growth at a more systemic, less cyclical level) may be at hand. This view would seem to be more in line with the view of the bond market than with that of equities.
As we said above – something’s gotta give. Will that “something” be a flat yield curve that tips into inversion? If so, what else gives? That will be something to watch as the second quarter gets underway.