Well, we’re 22 trading days into the pullback that started after the last S&P 500 record high set on April 30. That’s 123 fewer than the 145 trading days it took for the last pullback to regain its previous high, from September 2018 to April 2019. Which, by the by, was exactly the same number of market-open days – 145 – that it took the January 2018 correction to regain its former altitude. Interesting for those who like to read meaning into randomness, perhaps…But we digress! Because, yes, the S&P 500’s retreat of more than five percent from that April 30 high has the usual red lights flashing all across the CNBC screen and Dow point drops (always point drops, always the Dow, so much more dramatic than the more mundane percentage creeps) juxtaposed next to the head of a speechifying Robert Mueller. But the real story this week is in the bond market, and specifically the strange shape of the Treasury yield curve.
The Yield Scythe
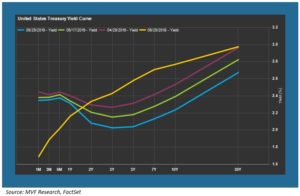
The chart below shows the evolution of the Treasury yield curve’s shape over the past month and compares it to what a more normal curve looked like one year ago. The blue line represents the most recent configuration of the curve, which looks like nothing more than a scythe ready to attack a field of wheat. Or a Marxist sickle missing its hammer, perhaps.

We’ve talked about the yield curve in these pages before, of course. The shape of the curve is important because an inverted curve – which is what is currently happening between short and intermediate term maturities – has historically been an extremely reliable predictor of recession. Every recession in the past sixty years has been ushered in by an inverted yield curve (though the timing between a curve inversion and the onset of a recession is subject to high levels of variance).
Do the Math
The relationship between the yield curve and the economy is not complicated, as bond math is entirely straightforward. Yields drop when prices rise, and prices on low-risk securities like US Treasuries rise when investors seek safe havens from riskier assets like stocks. When intermediate yields drop, it can signal the assumption by investors that central bankers will be pushing down short term rates.
Right now the Fed funds rate – the overnight lending rate between banks that the Fed effectively controls through its open market policy operations – is within a target range of 2.25 – 2.5 percent. You can see that short term Treasuries, which tend to move more or less in sync with the Fed funds rate, are all bunched around the middle of that target range, while the intermediate maturities of two to ten years all trade below the floor of the Fed funds range. In many ways, this is just a visual confirmation of what we already know to be true from other data sources like the Fed funds futures market. Bond investors expect at least one, maybe two, rate cuts before the end of the year. In other words, they look into the future and see a Fed funds target range with a floor as low as 1.75 percent – and where the Fed funds rate goes, those short-term Treasuries will follow. Then the yield curve would revert to something more like a less-steep version of that yellow line on the above chart.
But Where Is the Evidence?
The one missing piece in this puzzle is…well, actual evidence. Recall that we have just posted the lowest unemployment rate – 3.6 percent – since 1969. Real GDP growth remains positive, if not necessarily going gangbusters, and while corporate earnings have decelerated from the tax cut-fueled high of 2018, businesses’ top line sales continue to grow at a healthy pace – over five percent for Q1 of this year with almost all S&P 500 companies having reported. Low inflation continues to perplex the Fed. But the core personal consumption expenditure (PCE) index, the Fed’s preferred inflation gauge, also stayed below two percent for most of the second half of the 1990s, one of the strongest economic growth cycles in US history. A PCE of 1.6 percent – where it is today – shouldn’t set off alarm bells.
All this aside, it is generally not a good idea to blithely ignore whatever message the bond market may be sending. No recession appears to be looming on the horizon, and the case for immediate Fed rate cuts is not as glaringly obvious to us as the conventional bond investor wisdom seems to have it. But the yield curve in its strange, scythe-like form doesn’t appear to be going anywhere either, and we must continue to give it due attention.