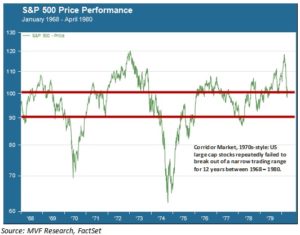
We have talked a great deal about the “corridor market” in our commentaries this year, observing that US large cap stocks have traded in a largely sideways patterns since the beginning of the fourth quarter of 2014. Over this time the S&P 500 has spent three quarters of its time – 76.4 percent to be exact – trading in roughly a 6 percent range between a ceiling of 2130 and a floor of 2000. The only deviations from the corridor have been three sharp downside moves: the Ebola freak-out in October 2014 and then the two technical corrections of August 2015 and January 2016. How much longer the market stays corridor bound is anybody’s guess, but we do have one noteworthy example of a decade-long stall-out. Put on your disco boots and wide lapels; we’re going back to the 1970s.
Right Back Where We Started From
The Maxine Nightingale song by that name came out in 1976, and it was true of the market as well. The S&P 500 started 1968 at a price level of 95. Eight years later, as 1976 opened, the index was…at 95. Right back where it started from, indeed. In fact, the S&P 500 would spend the rest of the ‘70s failing to sustain successive attempts to break out above 100 – the corridor ceiling of the day. On the downside, meanwhile, the index mostly managed to stay above 90, the two exceptions being the bear markets of 1968-70 and 1973-75. That made for a decade-long corridor of just 10 percent, illustrated by the chart below.

Ch-Ch-Ch-Changes
Now, there is no particular reason why stock price movements and trends in any one period should inform trends in other periods. Clearly much is different about markets and the world in general today as compared to 40-odd years ago. But we like to say that, while history does not repeat itself, it has a tendency to rhyme from time to time. There are some useful lessons to draw from the ‘70s; most importantly, in our view, of a transitional time between one economic order and another.
Consider that first major pullback, starting after the S&P 500 set an all-time high on November 29, 1968. For most of the 1950s and 1960s, the non-Communist world had enjoyed a return to international trade and cooperation after a devastating half-century of economic depression and two world wars. By 1968, though, the foundations underpinning this world order were starting to come undone. Inflation in the US was surging after a decade of growth and an unsustainable commitment to waging war in Vietnam. The US dollar, fixed at $35 per ounce of gold to promote stable terms of trade while the economies of Europe and Japan rebuilt their war-torn markets, was widely understood to be overvalued and incapable of maintaining its gold-equivalent value for much longer. That reckoning would come in August 1971 when President Nixon announced the end of gold-dollar parity.
Inflation was the chronic economic ill of the ‘70s. The second of the decade’s two bear markets came about with the OPEC oil production cuts of 1973 that resulted in a quintupling of oil prices in little more than a year. There were other reasons why stocks failed to sustain any breakout rallies for too long, but “stagflation” – economic growth that failed to keep up with price inflation – was the visible ailment as the economy transitioned from one accepted set of practices and institutions to something else – something not visible to observers of that age.
Stayin’ Alive
What inflation was to the 1970s, low growth and sagging productivity are to today’s market environment. Despite every stimulus effort of the Fed and other central banks around the world, economic growth remains stubbornly below the normal trend rates of the pre-2008 recession period. There is a palpable sense, too, that today’s stagnant incomes, reduced demand in major consumer markets and listless capital investment by businesses are outcomes of something more than the usual turning of the business cycle.
The crumbling of the Bretton Woods framework in the early 1970s eventually led to a new age of liberalized commerce, fueled by privatization, relaxed capital and trade regulations, and technology-driven innovations in consumer finance. This age produced an eighteen year run of near-uninterrupted growth in stock prices and a bull market in bonds that continues to this day.
What comes next, observers ask, as “trade” becomes a word of derision in political stump speeches and voters around the world seek easy answers (Brexit, populist authoritarian leaders) to the problems for which they hold the global elites, the beneficiaries of the post-1970s economic order, fully accountable? In the answer to that question may lie intelligence about the next sustained upside breakout. Meanwhile, that persistent corridor may be with us for a while yet.