New fiscal quarter and same old bull market, or so it would appear. Which probably should not come as much of a surprise, given the veritable absence of anything markets would find new and newsworthy. The Fed pivot has come and gone, the trade war turned out in the end to be a paper tiger, economic growth is slowing everywhere but still positive. Corporate earnings will be weaker than previous quarters but probably not as weak as the dramatically ratcheted-down estimates of Wall Street analysts. The old parlor trick of outperforming a low bar is back in full force! Meanwhile, the Brexit extension to the extension to the extension (which you, dear reader, will recall we predicted back in January) was agreed to during the same week that we got to see a picture of an actual black hole, in space. No coincidence, surely, between those two events.
The Rule of 145 Days
So the good times continue…depending on your perspective. Year to date? Things are great. The S&P 500 is up nearly 16 percent (in price terms) since the start of 2019, which is one of the best starts to a calendar year, ever. Moreover, the intraday tempo of this rally has been relatively calm, with only a small number of instances where the index moved by more than one percent from open to close.
If you step back and take a wider view, though, the picture looks a bit different.

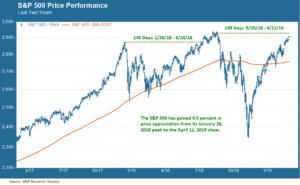
That 16 percent calendar year gain looks a bit different in the context of what preceded it: not just the sharp pullback of last autumn but a much longer trading period going back to January 2018. Here’s what has happened since the S&P 500 reached a then-all time high on January 26 of that year. There was a technical correction, followed by an arduous 145-day climb to a new record high (in August), then a bit more upward momentum to the record high of 2930 set on September 20. 135 days have passed since then, and now we are within striking distance of yet another record high (maybe, who knows, when the day count hits 145 again).
Wait-and-See Markets
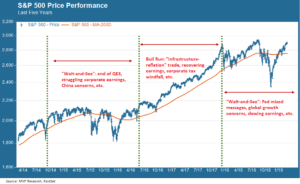
What this means in actual performance terms is that the S&P 500, as of yesterday’s close, had gained a grand total of 0.5 percent from that January 26, 2018 peak. That’s cumulative, not annualized. Zero point five percent is not the stuff of a robust bull. Arguably, this sixteen month period represents a distinct phase of the great bull market that started in 2009: a phase we would term “wait-and-see.” The previous phase was the exceedingly non-volatile stretch from November 2016 to January 2018 (which phase certainly qualified for the moniker “robust”), and before that was the Mid-Decade Pause (another wait-and-see period) that came on the heels of the Fed’s ending its last quantitative easing program in 2014 and persisted through summer 2016.
That 2014-16 period may be instructive. Below we extend that same S&P 500 chart shown above to encompass a longer time period, where this bull market’s distinct phases are evident.

Of course, and contrary to our tongue-in-cheek section heading above, there is no such thing as a “rule of 145 days.” But it does feel like we might be getting close to the end of this particular phase of the bull as the market closes in on a new record high. The question, as always, is what comes next. Recall that in 2016 there was not much in the way of a compelling case to make that would have predicted the bull run of 2017. The bond market for much of this year has been suggesting that slower times are ahead. But the tea leaves, as always, are subject to multiple interpretations.