
MV Weekly Market Flash: The...

The US stock market’s performance since the dark days of April has truly been something to behold. On April 8 the S&P 500 had fallen by 18.9 percent from its previous record high, set on February 19. On April 9, of course, the Trump administration punted its “Liberation Day” tariff plans three months down the road, and the markets took off. By the time that three-month pause came due, on August 1, the blue chip index had risen almost 28 percent from the April 8 low. Good times, if they can be maintained.
What About the Denominator?
But with that stellar price performance comes the usual scrutiny about valuations. This time, the scrutiny is particularly warranted, because valuations by some measures are probing fresh new nosebleed territory. Consider one measure, price to sales (P/S). We tend to like sales as a denominator for valuation ratios versus the more widely used price to earnings (P/E), for the simple reason that there is less room for distortion and accounting chicanery at the top line of the income statement versus the bottom line. So let’s look at the forward (next twelve months) price to sales ratio for the S&P 500, going back a quarter century, all the way back to the peak of dotcom mania at the end of 1999.

On average, investors on August 1 were willing to pay $3.08 on average for every dollar of a company’s revenue, slightly more than the $3.06 they were happy to fork over in early 2000, when the stock market crested ahead of its long, three-year slide during which the S&P 500 lost 49 percent from peak to trough.
Now, before anyone asks, we’re not here to say that history is about to repeat itself. Markets, and history generally, don’t work that way. Still, that is a milestone worth thinking about. The forward P/E ratio, which is what we are looking at here, represents the consensus forecasts of securities research analysts who cover these companies. The forward outlook today is better than it was three months ago; based on the current consensus among analysts covered by FactSet, a market research and analytics company, the outlook for second quarter sales is almost a full percentage point higher than it was four months ago. But those estimates can always change – and as we noted in our commentary last week, the economic picture for the remainder of the year continues to present more questions than answers.
Then there is the Shiller CAPE – the Cyclically Adjusted P/E ratio developed by Yale economist Robert Shiller that presents average real earnings over a ten-year period to smooth out the fluctuations and vagaries of shorter term figures.
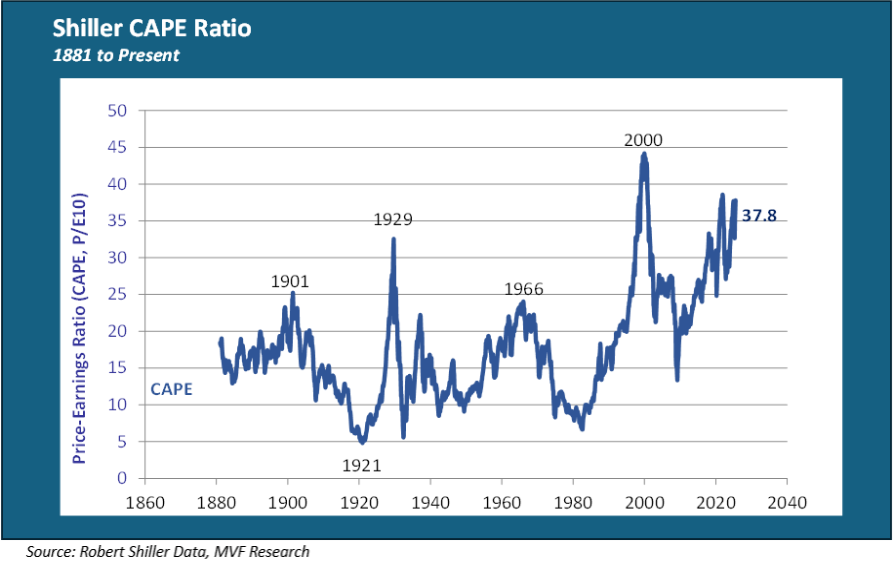
The current CAPE ratio of 37.8 is not as high as it was in 2000, when it neared 45. But it is still higher than at any other time since 1881, including the three major earlier secular bull markets that peaked in 1901, 1929 and 1966 respectively.
The Staying Power of Irrational Exuberance
As the time-tested saying goes, the market can stay irrational longer than you can stay solvent. Neither the CAPE nor, for that matter, any other valuation metric has ever been a reliable gauge for timing when to get out of the market and when to double down. The same is true today. The fact that prices are by some measures (e.g., sales) higher than they were at the peak of dot-com mania does not mean that they are due for a crash tomorrow.
In fact, the main driver of US stock price performance for the past couple months is largely the same one that has been driving price performance since the beginning of 2023: the AI narrative. The top two companies in the S&P 500 by market capitalization, Nvidia and Microsoft, make up fifteen percent of the total market cap for the index. The top eight companies, which include the aforementioned two plus Apple, Amazon, Meta Platforms, Broadcom, Alphabet and Tesla, account for 34 percent of total market cap, and all of them in one way or another represent a facet of the AI story. Debates about the practical role of artificial intelligence in the economy versus the theories and the hype abound, but so far the story has weathered a considerable amount of scrutiny without experiencing anything close to a knockout punch.
What investors can do, and what we have been sharing as strategic thinking with our clients this year, is to diversify exposure to US large cap equities away from levels that may have been prudent two years ago but are (in our opinion) less certain today. Non-US asset classes, both equities and fixed income, deserve closer consideration. So, to, do certain nontraditional asset classes. Trying to time the inflection points is a fool’s errand. Patient and careful diversification, we believe, is a better approach for the long term.