
MV Weekly Market Flash: The...

So here we are. The Wall Street Journal – not a publication known for any kind of a liberal bias – calls it the “dumbest trade war in history.” And that’s saying something, because there have been some epically dumb trade wars in the past. Take the infamous Smoot-Hawley Tariff Act, signed on June 17, 1930, just eight months after the Crash of ’29, which was supposed to help US manufacturing “bounce back” by creating a wall of protection around domestic industries but instead added more fuel to the conflagration that became the Great Depression. If the tariffs announced on April 2 all go into effect as stated, the average rate this time around will actually be higher than those of Smoot-Hawley.
But from an economic perspective, the Journal is right – these are even dumber, because they aren’t actually “reciprocal” tariffs as advertised by the administration. Cambodia, a poor country, has factories where workers make less than a dollar an hour to stitch together running shoes for export to the US, but Cambodia doesn’t buy a bunch of expensive Nvidia GPU semiconductors from us in return, so according to the blinkered trade logic of this administration, Cambodia deserves a whopping tariff rate of 45 percent because of this bilateral trade deficit. This completely unnecessary trade war is bad for Cambodia, bad for the US and bad for the rest of the world (though we assume the penguins on Heard and McDonald Islands, off the coast of Antarctica, are largely indifferent to the 10 percent tariffs now slapped on them).
When Fear Takes Over
This ill-conceived trade war has put financial markets back into a mode of fear, which means it is time for us to trot out the chart we always come back to in times like these.
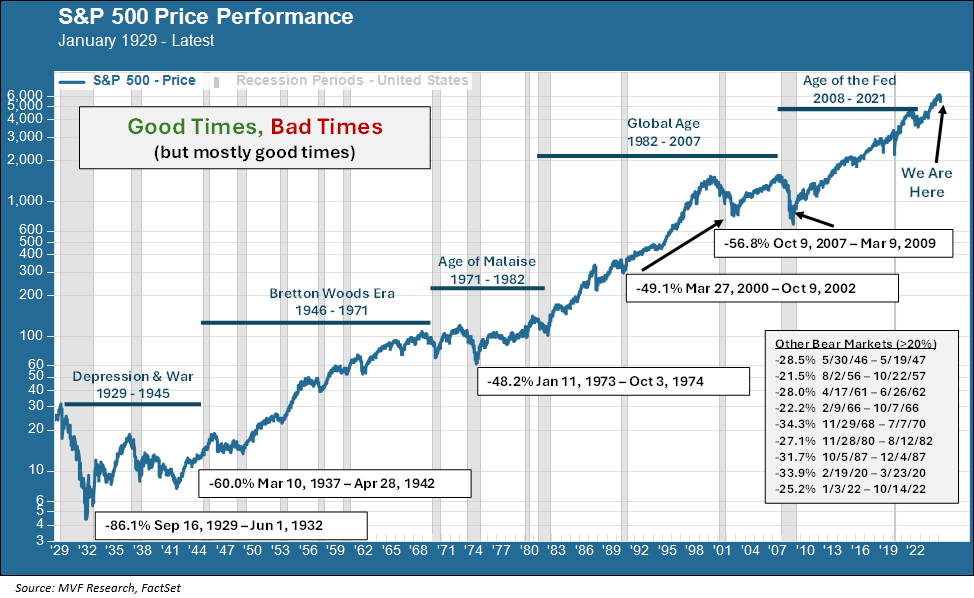
Yep, it’s the long-term price performance history of the US stock market since 1929, showing all the good times and bad times along the way. We highlight the five most prominent bear markets – two during the years of the Great Depression, one in the tumultuous decade of the 1970s, and the two bursting asset bubbles of the 21st century’s first decade. We then list the nine other bear markets – defined as a peak to trough reversal of more than 20 percent – that happened throughout this 96 year span of time.
There are really two main reasons why we think this chart is important for our clients in navigating through times of fear. The first is to show that, even when it has looked like the world was coming apart at the seams, sooner or later things always recovered. How soon? Well, in the case of the Covid-19 pandemic, the S&P 500 fell by 33.9 percent from its high point of February 19, 2020, to the low mark of March 23. It took only five months, though, to regain that high point, which it did on August 18 of the same year.
By contrast, the S&P 500 did not recoup its record high close of 31.86 on September 16, 1929, until 25 years later, on September 22, 1954. That was a quarter-century of depression, war and the early years of postwar reconstruction. Everything else falls somewhere in between those two endpoints. For example, it took about four years after the 2008 global financial crisis for the S&P 500 to regain all the ground it lost during that event.
Getting Back In Is Harder Than Getting Out
The second reason why we think this long-term chart is helpful is because it shows you what happens after the market hits its low point for the cycle – namely, that it starts to go back up, and in a manner typically characterized by large bursts of intraday gains. Here’s the key: being in the market when those post-trough gains happen is incredibly important for preserving your capital over the long term. The problem, of course, is that you never know in advance when that worst day will happen. Fear will keep you tentative and afraid of another shoe dropping – which, to be perfectly honest – often happens. False dawns are a regular feature of these bear cycles. The math is brutal: by the time you decide that things are bad enough to sell out, the market is presumably already down quite a bit from its last high point. But even that decision is easier than figuring out when it’s time to get back in. In the long run, you lose.
Nobody knows how this, the dumbest trade war in history, is going to play out. Much is going to depend on how other countries react. China, for example, has already made a first retaliatory move by matching the 34 percent tariffs on it announced Wednesday with the same level on all products it imports from the US. French president Macron has called for a cessation of investment into the US by his fellow Europeans. The idea that other countries are simply going to bend the knee in appeasement seems unlikely. More likely, we are probably in the early stages of a structural global realignment. There will be opportunities here as well as risks, and we will be looking to take advantage of those wherever possible.
In the meantime, though, we believe that the most prudent action we can take is to remain disciplined and avoid the temptation to give into fear. We will not be shy in communicating with you our views and specific courses of action we are taking as we assimilate more data from the shifting tectonic plates taking place in the global economy. Our commitment to discipline, with an eye always on the specific long-term growth objectives, risk tolerance and income needs of each one of you, will guide these actions.