Round numbers and anniversaries…the little human foibles so beloved of our financial chattering class. This past week, of course, marked the 10-year anniversary of the great collapse of the House of Lehman. No surprise, then, that the print and digital channels were all atwitter (pun partially intended) with reminiscing and ruminating about the crash and all that has happened since. There is a plentiful supply of topics, to be sure. Channeling the Mike Myers’ “Coffee Talk” character on SNL: “Negative interest rates led us to the other side of the Looking Glass. Tawk amuhngst yuh-selves.”
Supercalifragilistic S&P 500
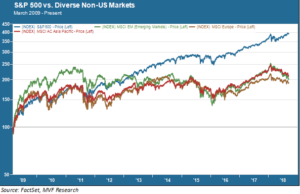
One fact of life to which we and everyone else who manages money are highly attuned is the remarkable outperformance of US equities relative to the rest of the world over this time period. For a while in the early years of the recovery geographic asset classes traded off market leadership in the usual way, rewarding traditional asset class diversification strategies. But sometime in 2012 that all changed. US stocks went on a tear and haven’t looked back. The chart below shows the trajectory of the S&P 500 against broad market indexes for developed Europe, Asia and emerging markets from 2009 to the present.

That’s a huge delta. The S&P 500 cumulatively returned about twice what the non-US indexes earned over this nine and a half year span of time. The difference is even more profound when you adjust for risk. All three non-US indexes exhibited higher volatility (i.e. risk) than the US benchmark. The standard deviation of returns for the MSCI EM index was more than 19 percent, just under 18 percent for developed Europe and 14 percent for developed Asia, while it was just 12.3 percent for the S&P 500. Twice the return for much less risk…sounds like one of those free lunches that are supposed to never exist, doesn’t it?
What Goes Up…Right?
And that, of course, is the big question. Since we are trained to believe that free lunches only exist at picnics hosted by the tooth fairy and the Easter bunny, we look at that chart and wonder when the law of gravity will reassert itself. Asset class price patterns over a long enough time horizon typically revert to mean. What goes up eventually comes down.
But asset prices are not bound by the same fixed laws as those governing physical objects in actual space-time. Economists and financial market theorists may suffer from all the “physics envy” they want – it won’t make asset prices any more rational or predictable. In fact, the “higher risk, higher return” mantra fails in the case of emerging markets versus US stocks over even longer periods, going back to when the former became a sufficiently liquid tradable asset to be a candidate for long-term diversified portfolios.
Mean reversion tends to work best when the primary evaluation criterion is the relative valuation metric between two assets. If Company ABC has a price to earnings (P/E) ratio of 30 and Company XYZ, a competitor in the same industry, has a price to earnings ratio of 10, then investors would at some point expect the price of XYZ to rise relative to ABC. But increasingly we see evidence that daily market trading is not dominated by stock-specific valuation considerations but rather by macro narratives. Continued demand for US equities is simply driven by a better “story” according to this narrative – strong corporate financial results and an economy that is growing faster than elsewhere in the developed world. The same thinking says that the US is a safer bet than elsewhere if the worst-case scenario for a trade war plays out. ETFs and other passive investment vehicles afford the opportunity to take these kinds of broad bets without paying any attention to whether, say, Unilever (a Dutch company) has a more attractive valuation profile than US-domiciled Procter & Gamble.
There are plenty of individual assets in many non-US markets that look attractive on the basis of relative valuations. We do not sense, however, that we are at a clear and compelling turning point justifying a significant re-weighting of asset class weights among diverse geographies.