
MV Weekly Market Flash: The...

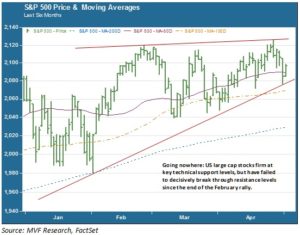
We are now one third of the way into 2015. What can we say about the state of things in the capital markets? US equities would appear to merit little more than “meh”. The S&P 500 saw out the month of April with a 1 percent drop and the Nasdaq pulled back 1.6 percent. As the chart below shows, stocks have spent most of the year so far alternatively bouncing off support and resistance levels. The longest breakout trend so far was the rally that started and ended almost precisely within the calendar confines of February. A directional move one way or the other will eventually happen, but the sluggish current conditions could persist for some time yet.
Unenthusiastic and Confused
If one could attribute human characteristics to the stock market, Mr. or Ms. Market would merit the sobriquets “unenthusiastic” and “confused”. These two attributes derive from already-expensive valuation levels, uninspiring company earnings, and a muddied picture of the overall economy in the wake of some recent soft headline numbers. At 17.0 times next twelve months (NTM) earnings, the S&P 500 is considerably more expensive than it was at the peak of the 2003-07 bull market, when the NTM P/E failed to breach 16 times. At the beginning of 2012 the NTM P/E was 11.6 times. After three years of multiple-busting expansion, investors’ current lack of conviction would hardly seem irrational.
Earnings: Clearing a Very Low Bar
This brings us to earnings. Expectations were grim as the Q1 earnings season got under way, with analysts forecasting negative growth in the neighborhood of -4 percent. That appears to have been a rather exaggerated take on the impact of the dollar, oil prices and other factors on earnings. With 72 percent of S&P 500 companies reporting, earnings per share (EPS) growth is 2.2 percent. The current consensus is for EPS growth to be more or less flat year-on-year when the results are all in (40 percent of energy companies have not yet posted, and their contribution will be largely negative). But zero percent growth, even if better than expectations, is not euphoria-inducing. The current EPS growth consensus for the full year is 1.5 percent. That’s roughly equal to the S&P 500’s price appreciation for the year to date, which may help to explain the stickiness of the current resistance levels.
Growth or No Growth?
Finally, an increasingly mixed picture of the US economy is stumping pundits and Fed governors alike. The Q1 GDP numbers released this week add another data point to the case for weak growth, joining the March jobs numbers, a string of below-trend retail sales figures, a downtick in consumer confidence, and soft manufacturing data. The question is whether this is merely a repeat of 2014 or something more enduring. Last year, an unusually cold winter helped drive negative Q1 GDP growth, but the economy snapped back nicely to grow at an average rate of 4.8 percent over the ensuing two quarters. Such was the gist of the Fed’s post-FOMC message this week: let’s wait and see what happens once the effects of winter and West Coast port problems are removed from the equation.
Since Q2 GDP will not be known before the Fed’s June conclave, we see almost no likelihood of any action on rates coming out of that meeting. That in turn will keep markets guessing for longer – potentially prolonging the duration of this uninspired “meh” market.