Every now and then we go back to the annual market outlook we published back in January, to see where our views have changed and where they are more or less the same. With regard to the economic landscape it appears that our views have changed very little indeed: the story largely remains the same. The recent string of headline macro indicators have been notable for their consistency, leading up to today’s release of yet another upside surprise in job creation. The unemployment rate is below 6% for the first time since before the 2008-09 recession. GDP and consumer confidence readings are robust, and inflation remains tame. Corporate earnings and the S&P 500 are up by about the same amount for the year to date, so valuation levels aren’t much different from where they were when the year began.
Trick or Treat
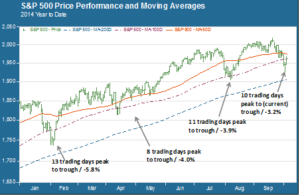
With such a humdrum top-level picture it would seem easy to make a good case for ambling into the end of the year with few surprises. But we’re in October now, folks, and we all know that this month can be full of nasty scares. There was some jitteriness earlier this week, with the S&P 500 pulling back about 3% from its record high set on September 18. A closer look, though, shows this to be part and parcel of this year’s pattern: intermittent, relatively shallow and brief reversals in an otherwise upwardly moving market with subdued volatility and modest share trading volume. The chart below shows the pullback history for the year so far:

Pullbacks of this magnitude offer little scope for defensive measures. By the time you build the defenses the market is already going back the other way. As the chart above shows, the support level of choice for the S&P 500 this year has been the 100 day moving average. Not that there is anything special about that or any other moving average – but if enough quantitative models are programmed to react to it, then perception creates its own reality. Nor is there any single compelling reason to argue as to why the pullbacks happen at the particular times they do. On any given day there are any number of X-factors in the mix – geopolitical flash points, health scares, currency markets turmoil – that could bubble up to the surface and cause mayhem. But there is no orderly pattern to how and when they impact asset prices. In this realm, chaos theory rules.
What We’re Watching
We are closely paying attention to some trends that could set up some bumps in the road. There is a continuation of flows out of riskier asset classes and a failure to hold technical support levels. Emerging markets equities are at or near 52-week lows. U.S. small caps are trading below their 200-day moving averages, and technical weakness is seeping into the mid cap sector as well. And while U.S. growth is leading the global economy, the picture is less rosy in Europe, Japan and elsewhere.
As long as the fundamental story in the U.S. stays more or less the same – and we don’t see too many data points out there to make a strong case otherwise – we think a little more upside is a likelier outcome than a major pullback. We continue to favor dollar-denominated assets and believe that a potential 25 basis points rate hike by the Fed next year is already baked into the cake (probably more so after today’s job numbers). Of course a larger correction could happen any time and we need to be vigilant. But even with a technical correction of 10% or so, we would see a buying opportunity as a more likely outcome than a slide towards secular bear territory.