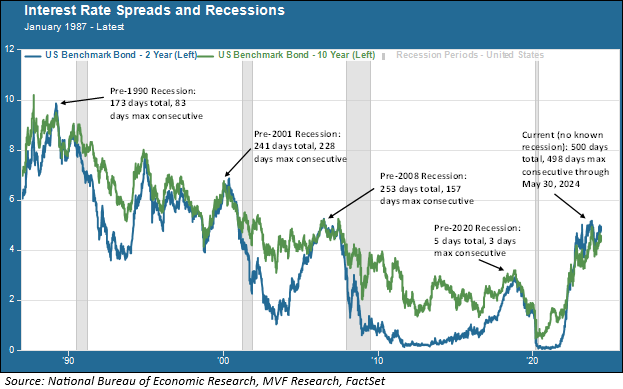
Today is one of those round number days the market loves to get excited about. No, not the Nasdaq Composite index reaching 17,000 – that happened a couple days ago and since then the index has given back the prize, currently trading around 16,800 as we write this. Today’s round number action takes place in the bond market. The Treasury yield curve has been inverted between the 10-year and 2-year maturities for 500 days, as of today, and will in almost all likelihood be adding to that total in the days and weeks (and months?) ahead.
This round number event is particularly salient as it will prompt another session of opining among market pundits as to whether this marks the end of the inverted yield curve’s usefulness as a recession warning. Is it the end for this fabled signal of stormy weather ahead? We decided to look at the numbers, going back to all the US recessions that have happened in the course of our working careers. Our opinion: not quite dead, but not at all well.
Inversions By The Numbers
Here are the numbers. Prior to the current inversion, which started in 2022, the 10-2 curve has inverted on four occasions since 1987. Each of these occasions was followed by a recession (with one asterisk, which we will get to in a moment).

By one measure, the total number of days in which the curve stayed inverted, something does seem to be seriously off. The 500 days of inversion in the current environment includes 498 consecutive days beginning on July 5, 2022 (the other two days occurred in April of the same year, with the curve resuming its normal shape before inverting for good on July 5). That is far, far longer than any prior period. Prior to this, the maximum total number of pre-recession inversion days was 253, before the 2008 recession, and within that period the maximum number of consecutive days was 157.
By another measure, though, it still may be too early to conclude that the current stretch of 500+ days will end without a recession. Here it is important to note that, for example, the curve inverted for the first time nearly three years before the recession of 2001. That recession officially started on April 2, 2001. The curve first inverted ahead of that on June 10, 1998. It inverted almost two years before the Great Recession of 2008, on December 27, 2005 (the official start date for that recession was January 2, 2008). By this measure, we could perhaps mark a sell-by date of around April 2025. If a recession hasn’t happened by then, three years after the curve first went negative, we would be prepared to consign the predictive powers of the inverted yield curve to the graveyard of metrics past (perhaps alongside the value bias and the small cap factor…).
False Positives and Pandemic Distortions
Now we come back to that asterisk we briefly noted above. Prior to 2020, one of the selling points of the inversion signal was the absence of false positives. Look again at the above chart. In those long growth cycles of the 1990s and the 2010s there was not one single instance of a 10-2 inversion apart from the ones signaling a recession. But in August 2019 the curve inverted for an ever-so-brief period of time, a grand total of five days between August 23 and September 2. That generated a lot of discussion at the time about the potential imminence of a recession.
We did have a recession, of course, in 2020. But not for any reason that could have been anticipated in September 2019, since that was four months before the appearance of the SARS Covid-19 virus in Wuhan, China and the subsequent global pandemic, the pandemic being the one and only reason why that recession of March 2020 happened (and lasted all of two months, a record in brevity).
So that brief period of inversion was, in fact, a false positive. Meaning that if the current inversion winds up conclusively without a recession to name – which we think is more likely than not – it will not be the first false positive, just the longest one.
The pandemic left in its wake a good deal of human suffering, but it also did a number on economic statistics. The highest unemployment rate of the postwar period happened during this brief period, as did the sharpest decline in real GDP growth. Supply chain bottlenecks and a flood of fiscal relief to households and businesses produced the highest period of inflation since the 1970s. Interest rates were kept artificially low for an extended period of time, then abruptly raised by the Fed in order to tame that inflation. Perhaps it is simply asking too much for metrics that worked in a different world to keep serving as reliable signals. In a world of noise, those signals are faint and hard to detect.