Watch the bond market: that was a core theme of our recent Annual Outlook and earlier commentaries in this brief, suddenly volatile year to date. Benchmark Treasury yields jumped on the first day of the year and never looked back. For the first month equities kept pace with rising yields, delivering the strongest January for the broad US stock market since 1987. Then it all went pear-shaped. Yields kept rising, while risk-on investors developed a case of the chills and sent stocks into a sharp retreat. The S&P 500 saw its biggest intraday declines since 2011, and the fastest move from high to 10 percent correction – 9 trading days – since 1980. Investors, naturally, want to know if this is just a long-overdue hiccup on the way to ever-greener pastures, or the start of a new, less benign reality.
The Expectations Game
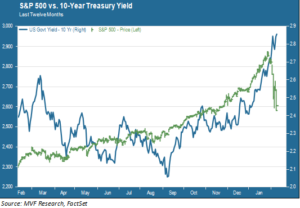
The chart below shows the performance of the S&P 500 and the 10-year yield for the past 12 months through the market close on Thursday.

What caused that abrupt change in sentiment? Investors seemed perfectly happy to watch the 10-year yield rise from 2.05 to 2.45 percent last September and October, and again from 2.4 to 2.7 percent over the course of January. What was it about the move from 2.7 to 2.86 percent to precipitate the freak-out in stocks? The most widely cited catalyst has been the wage growth number that came out in last Friday’s jobs report; after growing at a steady rate of 2.5 percent for seemingly forever, the wage rate ticked up to 2.9 percent in January. According to this train of thought, the wage number raised inflationary expectations, which in turn raised the likelihood of a faster than expected rate move by the Fed, which in turn led to portfolio managers adjusting their cash flow models with higher discount rates, which in turn led to the sell-off in equities this week.
Algos Travel in Packs
There is a kernel of truth to that analysis, but it doesn’t really explain the magnitude or the speed of the pullback. For more insight on that, we turn to the mechanics of what forces are at play behind the actual shares that trade hands on stock exchanges every day. In fact, very few shares trade between actual human hands, while the vast majority (as high as 90 percent by some estimates) trade between algorithm-driven computer models. The “algos,” as they are affectionately known, are wired to respond automatically to triggers coded into the models.
On most days these models tend to cancel each other out, sort of like the interference effect of one wave’s crest colliding with another’s trough. But a key feature of many of these models is to start building a cash position (by selling risk assets) when a certain level of volatility is reached. Even before the selling kicked in last week, the internal volatility of the S&P 500 had climbed steadily for several weeks, while the long-dormant VIX was also slowly creeping up. The wage number may or may not have been a direct trigger, but enough of these models read a sell signal to start the carnage. Rather than waves canceling out, it was more like crests meeting and growing exponentially. More volatility then begat more selling.
The Case for Promise
So we’ve been given a taste of the peril that can come from higher rates. What about the promise? Here we leave the mechanics of short-term market movements and return to the fundamental context. The synchronized growth in the global economy has not changed over the past two weeks. The Q4 earnings season currently under way continues to deliver upside in both sales and earnings growth, while the outlook for Q1 remains promising. If wages and prices grow modestly from current levels – say, for example, so that the Personal Consumption Expenditure index actually rises to the Fed’s 2 percent target – well, that is in no way indicative of runaway inflation.
This should all be good news; in other words, if the current global macro trend is sustainable, it would strongly suggest that the current pullback in risk assets is more like a typical correction (remember that these normally happen relatively frequently) and less like the onset of a bear market (remember that these happen very infrequently). Higher rates have an upside as well, when they reflect positive underlying economic health. With one caveat.
The Debt Factor
Call it the dark side of the “reflation-infrastructure trade” that caught investors’ fancy in late 2016. The US is set to borrow nearly $1 trillion in 2018, much of which is to pay for the fiscal stimulus delivered in the administration’s tax cut package. That borrowing, of course, takes the form of Treasury bond auctions. A weak auction of 10-year Treasuries on Wednesday is credited for pushing yields up (and stocks down) late Wednesday into Thursday. These auctions, of course, are all about supply and demand. Remember that brief freak-out in early January when rumors floated about China scaling back its Treasury purchases? Supply and demand trends stand to weigh heavily on investor sentiment as the year progresses.
Now, a great many other factors will be at play influencing demand for Treasuries, including what other central banks decide to do, or not do, about their own monetary stimulus programs. Higher borrowing by the US may be offset if overseas demand is strong enough to absorb the expected new issuance. Time will tell. In the meantime, we think it quite likely that the surreal quiet we saw in markets last year will give way to more volatility, and to sentiment that may shift several times more as the year goes on between the peril and the promise of higher interest rates.