Just when it looked like patterns were settling into a Groundhog Day sort of vibe, with Mr. Market waking up every morning to “I’ve Got You Babe” and another half-percent gain for megacap tech stocks…the past couple days have been different. Now, we are normally inclined to ignore the larger implications of such short-term moves, and this may well be yet another case of a mini-pullback that dissipates into the fog of investor confidence and central bank protection. But there are several different forces at play here, and their colocation at this particular moment could have some more durable implications.
Headline Says What?
We’re not used to getting surprises from headline macroeconomic data releases – the main ones (jobs, inflation, GDP growth) keep chugging along with little change from month to month. But today supplied a big fat surprise in the form of another closely-followed metric: the Markit PMI (Purchasing Managers Index) reading, which provides a gauge of business activity in both the manufacturing and the services sectors of the economy. A reading over 50 implies an expansion in activity while a reading below 50 indicates a contraction.
Today’s Composite PMI reading was 49.6, which was (a) contractionary and (b) substantially below the expected consensus of 53.2. Even more concerning was the main driver for the decline: a Services PMI result of 49.4 versus the consensus expectation of 53.3. Services make up about 80 percent of the US economy, so a reversal of this magnitude is the kind of thing that catches traders off guard and triggers a knee-jerk selling wave like what we are seeing this morning. Again – this is one number for one month and that alone does not a trend make. But it’s a stark enough counterpoint to bear close watching.
Bad Timing
The timing of this headline surprise is particularly unwelcome because several other things are going on at the same time – and not necessarily unrelated. The coronavirus is fast becoming this year’s trade war, in the sense of being a series of daily headlines that can instantly move markets one way or the other. These headlines have been fairly conflicted this week. One day we learn that the growth rate of new cases is tapering off, the next day brings new word of outbreaks and/or deaths in new locations. The longer this disease stays in the mainstream of news flow, the more questions come up about the state of all those highly intricate global supply chains with massive China exposure, not to mention demand trends from Chinese businesses and consumers. It is even possible that some such concerns crept into those PMI numbers which are, after all, a reading on activity based on the pace of new business orders.
Oh, and meanwhile the 30-year US Treasury yield has fallen below 2 percent for the first time since the big inverted yield curve bond scare early last September. No, the curve is not inverted now, but a sub-2 yield on the longest-maturity bond is not a sign of rude health.
Uh-Oh, Valuations Again
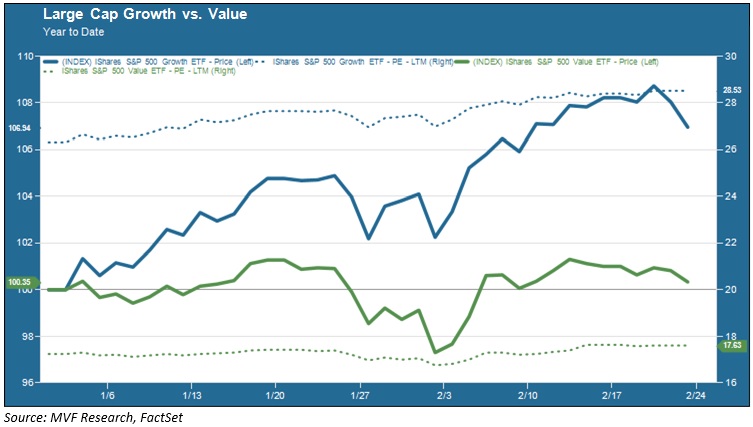
On top of everything else, this unfortunate timing shines anew a harsh light on the subject of stretched valuations we have been talking about now for some time. In fact, a close look at the last couple days of trading shows that the high-flying growth stocks which have carried the lion’s share of the overall market’s gains for the better part of half a decade fell further than their value counterparts. Now, we have been quick in the past to point out what we see as built-in limits to the factor rotation story every time one of these days happens (the most recent case being the effervescent “Rotation Monday” early last September). But when you look at the relative performance of growth and value stocks it is hard not to beam into the wildly divergent valuation levels of each asset class. The chart below shows the year-to-date pattern of the S&P 500 Growth and Value indexes (using ETF proxies for the indexes) and the associated last-twelve-months price-to-earnings (P/E) ratios.

Normally we wouldn’t see anything particularly troubling about a reversion to mean – in the case of value versus growth, there are plenty of market pros who have been waiting for a seeming eternity for this to happen. Look at the comparison of P/E ratios: 17.6 times for large cap value (green dotted line), 28.5 times for large cap growth (blue dotted line). That is no small difference.
But for a factor rotation to be meaningful and durable there should be some reasonably compelling underlying fundamentals, and here is where the story becomes problematic. A significant portion of value stocks are housed in two industry sectors – financials and energy – that do not seem to offer much of an attractive upside case. Energy stocks are weighed down by chronically weak prices for major energy commodities like crude oil and natural gas. More recently, these stocks have been on the opposite side of one of the biggest recent market dynamics – the headlong rush into ESG (environmental, social and governance) stocks for which “not fossil fuels” is a top-level directive.
Financials, meanwhile, labor under the unforgiving yoke of the Fed and its apparent “easy money forever” mandate. So making a fundamental, durable market case for value is a challenging obstacle. Meanwhile, of course, the bulk of the S&P 500’s market cap is firmly housed on the growth side, after so many years of relentless outperformance. As we noted in a recent commentary, just five of these stocks account for about 20 percent of the total index in market cap terms. The factor rotation math does not look appealing. Less so, of course, in light of those other forces at play we described earlier.