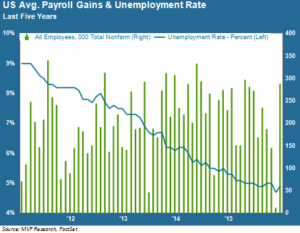
It is perhaps appropriate that jobs reports in the middle months of 2016, the Year of Anything Goes, confound the consensus expectations to a much greater degree than they did in the comparatively sane world of 2015. Last month the FactSet analyst consensus projected payroll gains of 160,000 for May; the BLS report delivered 38,000 (subsequently revised down to 11,000). This month, the consensus plodded right along with a 180,000 estimate. In a reversal of fortune (or, statistically speaking, trading places with the other end of the margin of error) the payroll gains for June shot up to 287,000. That’s 2016 in a nutshell: you never know what version of reality will show up on the day, but the experts will be reliably wrong in either case.

All Well, Move Along
The chart above, our go-to headline snapshot of payroll gains and the unemployment rate, shows that, despite the wider fluctuations of the last couple months and fewer incidents of 200,000-plus gains compared to previous years, there is not much in the US jobs picture to suggest a worsening domestic economic picture. That remains true below the headline numbers: the participation rate is steady (if well below historical norms), wages continue to outpace inflation, and weekly unemployment benefits claims remain at very low levels. Other measures like reluctant part-time workers (looking for full-time work) and the long-term unemployed show little change from month to month. In the context of other key data points like inflation, GDP, consumer confidence and retail spending, the overarching story remains more or less the same: growth that is slow by post-World War II long-term trendlines, but growth nonetheless. And better, more consistent growth than elsewhere in the developed world.
Stocks Have a Say…
US stocks signal a positive reaction to the jobs data, though it is still too early in the day to call a win. That pesky S&P 500 valuation ceiling of 2130 looms ever closer – just a rally or two away. US stocks seem to have been caught up in the post-Brexit flight to quality story, mixed up with the usual safe haven plays of Treasuries, gold and the yen, and today’s jobs report may play easily into that sentiment. Money has to go somewhere, and even at rich valuation levels US stocks make a more compelling story than other geographies. Central banks have had some measure of success in pushing bond investors out of their once-safe habitats into riskier assets. If you’re a traditional bond investor forced to make a bigger allocation to equities, your first port of call would logically be blue-chip US names with high dividend payouts. This trend could continue to suggest relative outperformance by US equities.
…And So Do Bonds
The bond market is communicating a view as well; the problem is that the language can seem as intelligible to the average investor as Ixcatec or Tharkarri . What does it say about the world when precisely every single maturity for Swiss government bonds, right out to 50 years – 50 years! – carries a negative interest rate? Think about the logic behind those yields: is there really no better way to invest one’s savings than to pay the Swiss government for the privilege of holding its debt for half a century? The only rational economic argument to make for the viral spread of negative interest rates is that, if general price levels in the economy fall over a long time, it sorta-kinda makes sense to hold a security that falls in value by less. That’s a pretty pessimistic take on the next 50 years, though.
And it’s not just in Europe or Japan – Treasury rates here in the relatively strong US are also at all-time lows, if at least still breaking positive. This goes back to the point we made a couple paragraphs above: domestic stocks and bonds both seem to be tagged as safety assets, unlike the usual situation where stocks and bonds move in opposite directions. The normal rules appear to no longer apply. But hey, it’s 2016. Anything goes.